the Creative Commons Attribution 4.0 License.
the Creative Commons Attribution 4.0 License.
 | 19 Sep 2018
Now you see it, now you don't: a case study of ephemeral snowpacks and soil moisture response in the Great Basin, USA
Rose Petersky
Ephemeral snowpacks, or those that persist for < 60 continuous days, are challenging to observe and model because snow accumulation and ablation occur during the same season. This has left ephemeral snow understudied, despite its widespread extent. Using 328 site years from the Great Basin, we show that ephemeral snowmelt causes a 70-days-earlier soil moisture response than seasonal snowmelt. In addition, deep soil moisture response was more variable in areas with seasonal snowmelt. To understand Great Basin snow distribution, we used MODIS and Snow Data Assimilation System (SNODAS) data to map snow extent. Estimates of maximum continuous snow cover duration from SNODAS consistently overestimated MODIS observations by >25 days in the lowest (<1500 m) and highest (>2500 m) elevations. During this time period snowpack was highly variable. The maximum seasonal snow cover during water years 2005–2014 was 64 % in 2010 and at a minimum of 24 % in 2014. We found that elevation had a strong control on snow ephemerality, and nearly all snowpacks over 2500 m were seasonal except those on south-facing slopes. Additionally, we used SNODAS-derived estimates of solid and liquid precipitation, melt, sublimation, and blowing snow sublimation to define snow ephemerality mechanisms. In warm years, the Great Basin shifts to ephemerally dominant as the rain–snow transition increases in elevation. Given that snow ephemerality is expected to increase as a consequence of climate change, physics-based modeling is needed that can account for the complex energetics of shallow snowpacks in complex terrain. These modeling efforts will need to be supported by field observations of mass and energy and linked to finer remote sensing snow products in order to track ephemeral snow dynamics.


Seasonal snowmelt supplies water to one-sixth of the world's population, which supports one-fourth of the global economy (Barnett et al., 2005; Sturm et al., 2017). Seasonal snowpack provides predictable melt timing and volumes in the spring, which influences streamflow timing, surface water, and groundwater availability (Berghuijs et al., 2014; Jasechko et al., 2014; Stewart et al., 2005). Reliable spring snowmelt also provides a strong control on vegetation phenology and productivity in many ecosystems (Parida and Buermann, 2014; Trujillo et al., 2012). Despite the importance of seasonal snow to water supplies, much of the world's snow is ephemeral (or intermittent), which means it melts and sublimates throughout the snow cover season instead of having one consistent period of snowmelt. Even small shifts from seasonal to ephemeral snowpacks due to regional warming could disrupt snowmelt rates and timing. A shift from seasonal to ephemeral snowpacks will also have negative implications for the winter tourism that requires continuous snow cover, as well as water management and hydropower that relies on the predictability of snowmelt from mountain reservoirs (Schmucki et al., 2017; Sturm et al., 2017). The hydrological impacts of ephemeral snowpacks have received little study.
Snowmelt influences a variety of terrestrial hydrological processes and states, particularly soil moisture dynamics in areas with low summer precipitation (Harpold and Molotch, 2015; Seyfried et al., 2009). Snowmelt-derived soil moisture is a primary control on streamflow generation and timing and ecosystem productivity in many semi-arid systems (Jefferson, 2011; McNamara et al., 2005; Schwinning and Sala, 2004; Stielstra et al., 2015; Trujillo et al., 2012). Although few studies have isolated their hydrological importance, ephemeral snowpacks modify the intensity and duration of precipitation inputs to soil by storing and releasing water in a less predictable way than seasonal snow. For example, McNamara et al. (2005) described five predictable phases of soil moisture evolution in semi-arid watersheds with seasonally dominant snowmelt: (1) a summer dry period; (2) a transitional fall wetting period; (3) a winter wet, low-flux period; (4) a spring wet, high-flux period; and (5) a transitional late-spring drying period. Soil moisture response to ephemeral snowmelt is likely to sit between the predictable timing and rates of seasonal snow and the stochastic nature of rainfall, but few observations across this gradient exist. Despite the hydrological and ecological importance of ephemeral snow, there are no widely accepted methodologies to classify, map, and model snow ephemerality.
One commonly used snowpack classification system by Sturm et al. (1995) divides snowpack into six categories and defines ephemeral snowpacks as those persisting for less than 60 consecutive days, are less than 50 cm depth, and have less than three different snow layers (Sturm et al., 1995). While it is arbitrary, using the 60-day threshold allows for comparisons between the extent of ephemeral snow to previous studies and among different areas. The Sturm et al. (1995) classification system is also incorporated into physical snowpack models, such as SnowModel (Liston and Elder, 2006), to separate seasonal and ephemeral snowpacks into different modeling domains. Models often make this separation because the energetics of ephemeral snowpacks are much more sensitive to basal melt from ground heat flux. Additionally, cold content varies more rapidly through time in shallow ephemeral snowpacks. Most physics-based models (e.g., Liston and Elder, 2006) are optimized for seasonal snow and produce less accurate results over ephemeral snow (Kelleners et al., 2010; Kormos et al., 2014).
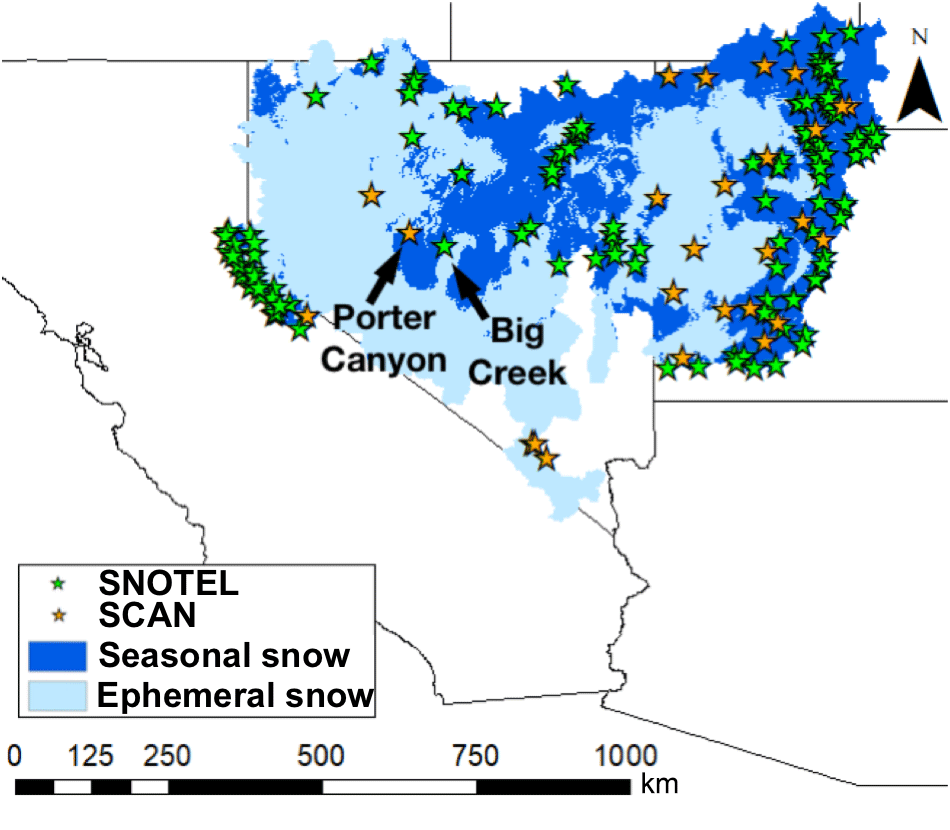
Figure 1Locations of SNOTEL and SCAN stations in the Great Basin, USA, in ephemeral and seasonal snow as defined by <60 or ≥60 days of maximum consecutive snow duration, respectively.
Ground-based and remote sensing observations have their own strengths and weaknesses for observing ephemeral snowpacks and soil moisture response. Most ground-based snow measurement stations (e.g., the Natural Resources Conservation Service Snow Telemetry, NRCS SNOTEL) in the Great Basin, and the western United States, are built to observe seasonal snow (Fig. 1). This is because sites are typically placed in topographically sheltered forest gaps that retain snow longer than nearby terrain. This improves the skill of streamflow forecasting, the primary goal of the SNOTEL network, but means that most SNOTEL sites only have ephemeral snow cover in exceptionally dry or warm years (Serreze et al., 1999). Only 2 of the 131 SNOTEL stations in the Great Basin experienced an ephemeral snow season on average (Fig. 1) each water year from 2005 to 2014. The scarcity of ground-based ephemeral snow and soil moisture data has changed slightly in recent years with additional measurements at the NRCS Soil Climate Analysis Network (SCAN) (Fig. 1) and increased deployment in research watersheds (Anderton et al., 2002; Jost et al., 2007). On average, 26 out of 39 SCAN stations in the Great Basin experienced ephemeral snow cover each year (Fig. 1). However, the lack of field observations from ephemeral snowpacks with co-located soil moisture has limited previous investigations (e.g., Sturm et al., 2010).
Spectral remote sensing collects observations over all cloud-free areas but has its own sets of advantages and challenges for observing ephemeral snow. One issue is that there are multiple methods to define the start and end of the observed snow-covered period. Often, it is defined as the date of the first and last remotely sensed observations of snow cover (e.g., Choi et al., 2010; Kimball et al., 2004; Nitta et al., 2014). Because this approach does not account for intermittent snow-free periods, it tends to overestimate snow duration and miss important ephemeral dynamics (Thompson and Lees, 2014). Snow persistence thresholds can be used to define snow ephemerality, but no standard persistence threshold exists (e.g., Gao et al., 2011; Karlsen et al., 2007). Given the intermittent nature of ephemeral snow, observations must be daily or finer to capture its dynamics (Wang et al., 2014). Consequently, products like Landsat that has a 16-day overpass and Sentinel that has 5–10-day overpass do poorly at estimating snow seasonality compared to products like the MODIS that have twice daily overpass, but they offer untapped potential for merged products with higher spatial and temporal resolution. Moreover, high cloud cover reduces observation frequency and limits the ability to observe ephemeral snow events. Like with ground-based snow research, some remote-sensing-based studies exclude ephemeral events altogether (e.g., Sugg et al., 2014). Only a limited number of algorithms have been developed to handle ephemeral snow specifically. For example, the algorithm developed by Thompson and Lees (2014) uses daily MOD10A1 data and accounts for snow absences in the middle of the snow season, but their study was challenging to verify and applied only in a small area of Australia. Given the current lack of ground-based observations (Fig. 1), there is great potential to use finer-scale satellite products and employ more refined methods targeted at areas with ephemeral snow.
There are a variety of underlying processes that cause ephemeral snowpack and challenge snow models. Based on previous classification systems, we define three mechanisms causing ephemeral snowpacks: (1) rainfall limiting the accumulation of snowpack, (2) snowpack ablation from melt or sublimation, and (3) wind scour removing snowpacks. All of these mechanisms have a variety of underlying atmospheric and snowpack processes that challenge prediction with snow models. At rain–snow transition elevations, even small temperature variations and other atmospheric variables can alter the mixture of rainfall and snowfall (Harpold et al., 2017b; Jefferson, 2011; Klos et al., 2014). Complete snow water equivalent (SWE) removal from melt or sublimation is also another common cause of snow ephemerality (Clow, 2010; Leathers et al., 2004; Mote et al., 2005; Sospedra-Alfonso and Merryfield, 2017). Typically, physics-based models overestimate modeled SWE in ephemeral snowpack, due to neglect or underestimation of ground heat flux and the challenges of tracking cold content in shallow snowpacks (Cline, 1997; Hawkins and Ellis, 2007; Kelleners et al., 2010; Kormos et al., 2014; Slater et al., 2017; Tyler et al., 2008; Şensoy et al., 2006). Models parameterize energy fluxes differently, which can lead to differences in model estimates of sublimation and melt (Essery et al., 2009; Schmucki et al., 2014; Sospedra-Alfonso et al., 2016). Removal of snowpack from wind scour is an important control on snow accumulation in alpine regions but is often neglected in models altogether (e.g., Mernild et al., 2017; Pomeroy, 1991; Winstral et al., 2013). Widespread evidence exists that wind redistribution of snow can cause ephemeral snowpacks that are consistent from year to year because of topography and dominant wind directions (Hood et al., 1999). The three mechanisms causing ephemeral snow (i.e., rain–snow transition, ablation by sublimation and melt, and wind scour) have fundamentally different underlying causes, with variable and poorly quantified sensitivities to climate and land cover variability.
The goal of this paper is to use the Great Basin as a case study to estimate the distribution and mechanisms causing ephemeral snow to better constrain their impact on soil moisture and hydrological response. We adapt the classification from Sturm et al. (1995) to map snow and soil moisture response across the Great Basin, compare remotely sensed and modeled estimates of ephemeral snow, and develop our own metrics to further classify snow seasonality. The Great Basin is ideal for this investigation because it spans dramatic gradients of elevation and hydroclimatology with large areas of both seasonal and ephemeral snow. This prototypical area depends disproportionately on mountain snowpack for water supplies, contains few ground-based observations, and there is relatively little winter cloud cover to limit spectral remote sensing techniques. Three research questions guide our analyses of ephemeral snowpacks in the Great Basin. (1) What are the implications for soil moisture from seasonal to ephemeral snowmelt? (2) How does topography affect snow seasonality? And (3) what mechanisms cause ephemeral snowpacks and how does that vary with climate? We find that ephemeral snow originates from melt and shifts to lower-elevation rain–snow transitions during warm winters, which leads to a fundamentally different soil moisture response than from seasonal snowmelt.
The Great Basin is the closed basin between the Wasatch and southern mountain ranges in Utah and the eastern slope of the Sierra Nevada mountain range in California. The region is known for having “internal drainage”, which means that none of the waterways travel to the ocean (Svejcar, 2015). The climate is semi-arid and the ecosystem is shrub-dominated (Svejcar, 2015; West, 1983). We defined the Great Basin region based on the hydrologic unit code (HUC) Region 16 adapted from Seaber et al. (1987) by the United States Geological Survey (USGS) (Fig. A1). Precipitation in the Great Basin varies widely between <10 cm in many of the lower elevations and >100 cm in many of the high-elevation mountains (Fig. A2). Overall, the Great Basin has a mean winter (defined as 1 December to 1 April) precipitation of 12 cm and a mean winter temperature of 0.4 ∘C (Fig. A2; Abatzoglou, 2012).
In order to compare the effect of snow ephemerality on soil moisture patterns, we first investigated snow and soil moisture response for SNOTEL and SCAN stations within the Great Basin. To evaluate how soil moisture varies based on snowpack parameters during a drought year (water year 2015) and a non-drought year (water year 2016), we chose two SNOTEL stations – Porter Canyon (ID 2170, elevation 2191 m) and Big Creek Summit (ID 337, elevation 2647 m) – that differ in elevation but are in close proximity. We used average snow water equivalent (SWE) data from snow pillows to determine snow cover. We categorized each day as snow covered if continuous SWE was greater than 0.1 cm. We then designated site years as seasonal or ephemeral depending on if continuous snow cover was greater or less than 60 days, respectively. For these stations, we compared percent soil moisture, at 5 and 50 cm soil depth along with snow depth, and SWE. We then also acquired soil moisture and SWE data at 5 and 50 cm for all the SNOTEL and SCAN stations in the Great Basin in water years 2014–2016 and categorized site years from those stations as ephemeral or seasonal. We discarded years and stations containing more than 7 days of continuous missing data or soil moisture values that were 0 %. To compare the timing of snow and peak soil moisture, we then took the difference between the day of last snow and the day with peak median 10-day soil moisture for each year at each site. It should be noted that ablation on the snow pillow may be impacted by differences in ground heat flux and co-location issues with the soil moisture sensors. We also calculated the coefficient of variation (CV; 1 standard deviation divided by the mean) of soil moisture for each year at each station.
We mapped ephemeral snow across the Great Basin using two methods: spectral remote sensing with MODIS data and modeled Snow Data Assimilation System (SNODAS) data. We used Google Earth Engine to analyze the data, which is a cloud-based computing platform optimized for mapping large datasets (Gorelick et al., 2017). The MODIS dataset used was the 2010 MODIS/Terra Snow Cover Daily L3 Global 500 m Grid (MOD10A) and we used the normalized difference snow index (NDSI) with parameters outlined in Hall et al. (2006) to find fractional snow-covered data. The equation for calculating NDSI in MOD10 is
A pixel is then mapped as containing fractional snow using the NDSI value, as long as the reflectance in Band 2 is >10 % (Hall et al., 2001). We classified all pixels with a snow fraction of 30–100 as snow, pixels with snow fractions between 0 and 30 as no snow, and pixels that had all other designations as other. We also used an algorithm derived from Thompson and Lees (2014) to minimize the impact of cloud cover in our MODIS data. The algorithm “grows” the boundaries of all areas containing snow and reclassifies pixels that were classified as other to snow if the corresponding pixels in the previous image were classified as snow. It also reclassifies pixels that were classified as other to no snow if the corresponding pixels in the previous image were no snow.
To determine the number of ephemeral and seasonal snow events, we used a Google Earth Engine function to note the day of the water year when snow appeared (when a pixel went from being classified as no snow in the previous day to classified as snow in the current day) and when snow disappeared (a pixel went from being classified as snow in the previous day to being classified as no snow in the current day), and we determined the length of snow cover by subtracting the day of snow appearance from the day of snow disappearance. If the length of snow cover was <60 days, then the snow event was classified as ephemeral. Otherwise, if the length of snow cover was ≥60 days, the snow event was categorized as seasonal. In addition to these metrics, we derived a snow seasonality metric (SSM) to quantify a MODIS pixel's tendency to have ephemeral or seasonal snow, rather than a binary metric like <60 days. The SSM is depicted in Eq. (2) and it works by classifying every day where there was seasonal snow present as 1 and every day where there was ephemeral snow present as −1, and then averaging all −1 and +1 values. This created a −1 to 1 scale, where −1 signifies that all the snow-covered days in a given pixel within 1 water year were ephemeral and +1 signifies that they were all seasonal.
Additionally, we discarded all instances where snow was absent for 1 day only from the overall record of snow disappearance and appearance because there were numerous artifacts from the MOD10A NDSI processing that lead to single-day snow disappearance during long stretches of snow cover. The 1-day snow events were also removed from the SNODAS algorithm to make both algorithms more consistent. For each water year from 2005 to 2014, we recorded the maximum total number of days where snow was present (to be referred to as the maximum snow duration).
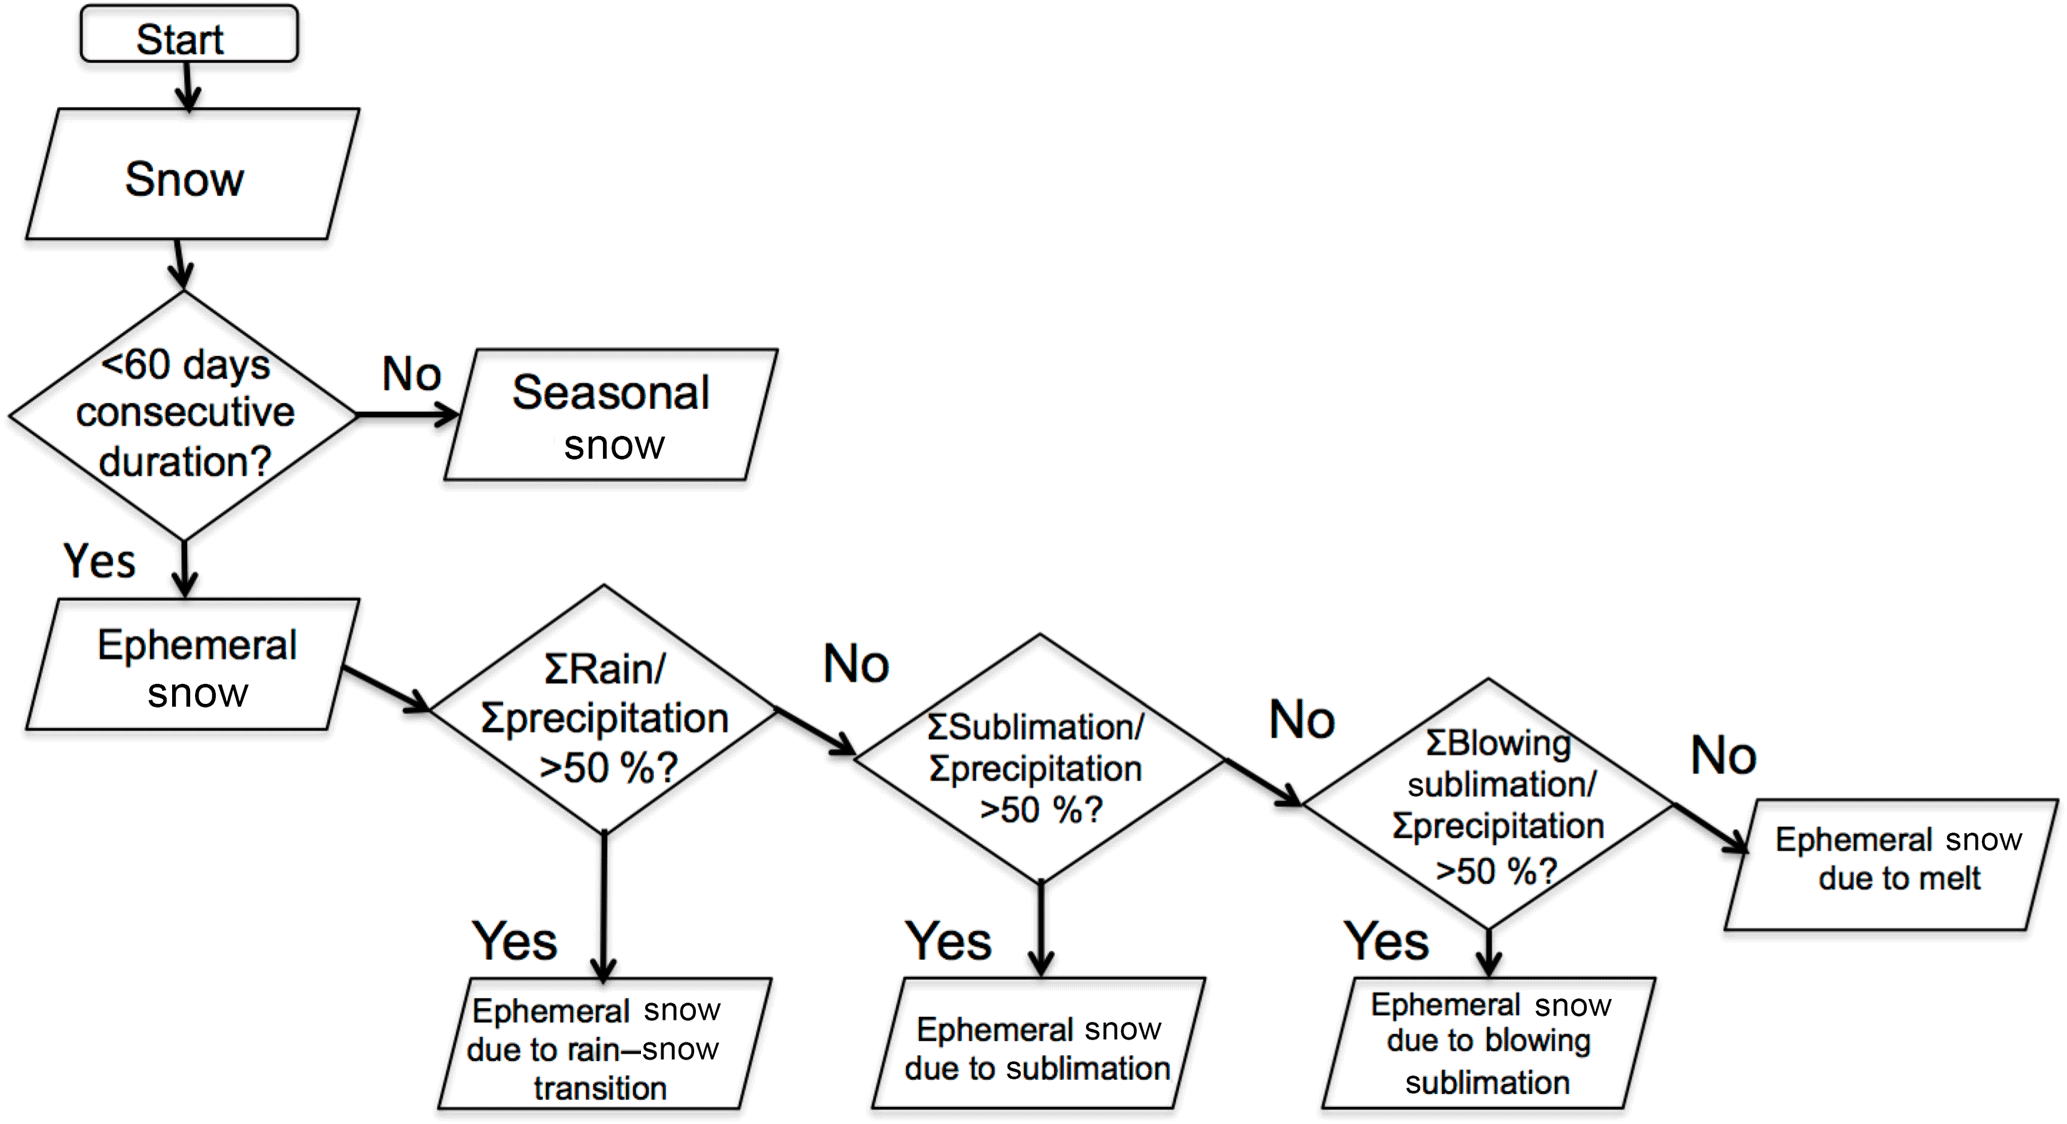
Figure 2Diagram of the process for the ephemeral snow mechanism model. Seasonal snow outputs were rejected, and all other outputs were categorized.
To determine the relationship between elevation and snow seasonality, we took the average maximum snow duration across water years 2005–2014 and used elevation and aspect as measured by a digital elevation model (DEM) obtained from the Shuttle Radar Topography Mission resampled to the same resolution with bilinear sampling (Farr et al., 2007). To calculate northness, we used the following equation:
We then categorized each MODIS pixel based on five 500 m elevation bins from a range of 1000 to >3000 m. Then, to remove bias based on the size of each bin, we used random sampling to make each bin contain the same number of points as the least full bin (13 548 points that were >3000 m). Then we combined each resampled bin into one dataset and created heat maps to compare the elevation vs. the average maximum snow duration. We also use the same method to compare aspect to average maximum snow duration using eight 45∘ bins from a range of 0 to 360∘. We randomly sampled 195 163 points from each bin (with the size of the bin ranging from 315 to 360∘). After resampling, we combined all the bins together and split them into three elevation categories: low elevation (elevation <1500 m), medium elevation (1500≥ elevation <2500), and high elevation (elevation ≥ 2500 m). Then, we resampled again to 82 823 points per bin (the size of the high-elevation bin).
We used SNODAS data to differentiate the mechanisms that cause snow to become ephemeral. The four mechanisms were assigned if the net ablation (or rain) exceeded 50 % of the total winter precipitation (Fig. 2): (1) a mixture of rain and snow limiting snow accumulation (the rain–snow transition), (2) snowpack loss due to sublimation, (3) snowpack loss due to melt, and (4) snowpack loss due to wind scour. We determined the prevailing mechanism in each 1000 m SNODAS pixel in each year. We used Google Earth Engine to execute the modeled algorithm on each 1000 m SNODAS pixel in the Great Basin. We then chose 6 years (2009–2014) and created histograms of each mechanism by elevation for each year.
4.1 Ephemeral snow and soil water inputs
In order to quantify differing soil moisture responses between seasonal and ephemeral snowpacks that have important ecohydrological implications for the Great Basin, we use the five phases in the McNamara et al. (2005) framework for soil moisture response to seasonal snowmelt. First, we qualitatively compare two nearby sites with differing snow regimes. Second, we make quantitative analyses using all of the soil moisture records available in snow-covered places of the Great Basin (Fig. 3).
We contrast soil moisture response at two adjacent SNOTEL stations that differ in elevation by >500 m (Fig. 1) to illustrate differences between ephemeral and seasonal snowmelt. Soil moisture at 5 and 50 cm depth was used to represent shallow and deep responses during a drought year (water year 2015) and a typical year (water year 2016). Porter Canyon had ephemeral snow (28 days maximum duration) in 2015 and seasonal snow (116 days) in 2016 (Fig. 3a). Big Creek had seasonal snowpack both years, although much shallower snowpack in 2015 (Fig. 3b). When seasonal snowpack is present at both sites in 2016, soil moisture follows the phases outlined by McNamara et al. (2005) for a semi-arid, snowmelt-driven environment. Shallow and deep soil moisture was in a low-flux state during December–February (DJF) at Big Creek in 2016 (Fig. 3f). During March–May (MAM), soil moisture increased substantially and was in a high-flux state. Average shallow soil moisture in 2015 and 2016 was similar in the MAM period (24.4 % and 24.8 %, respectively) and DJF period (11.3 % and 19.8 %), suggesting that snow storage and melt negates differences in early season soil moisture between years with very different winter precipitation. Porter Canyon also showed a similar soil moisture increase in the MAM period after a stable low-flux pattern in the DJF period during water year 2016. Both sites also reach their near maximum annual soil moisture coincident with snow disappearance in 2016 (Harpold and Molotch, 2015), but Porter Canyon has snow disappearance in both years that preceded peak soil moisture by several months. The deeper 50 cm soil moisture had a smaller and shorter peak during 2015 at Porter Canyon as compared to 2016 and the Big Creek response.
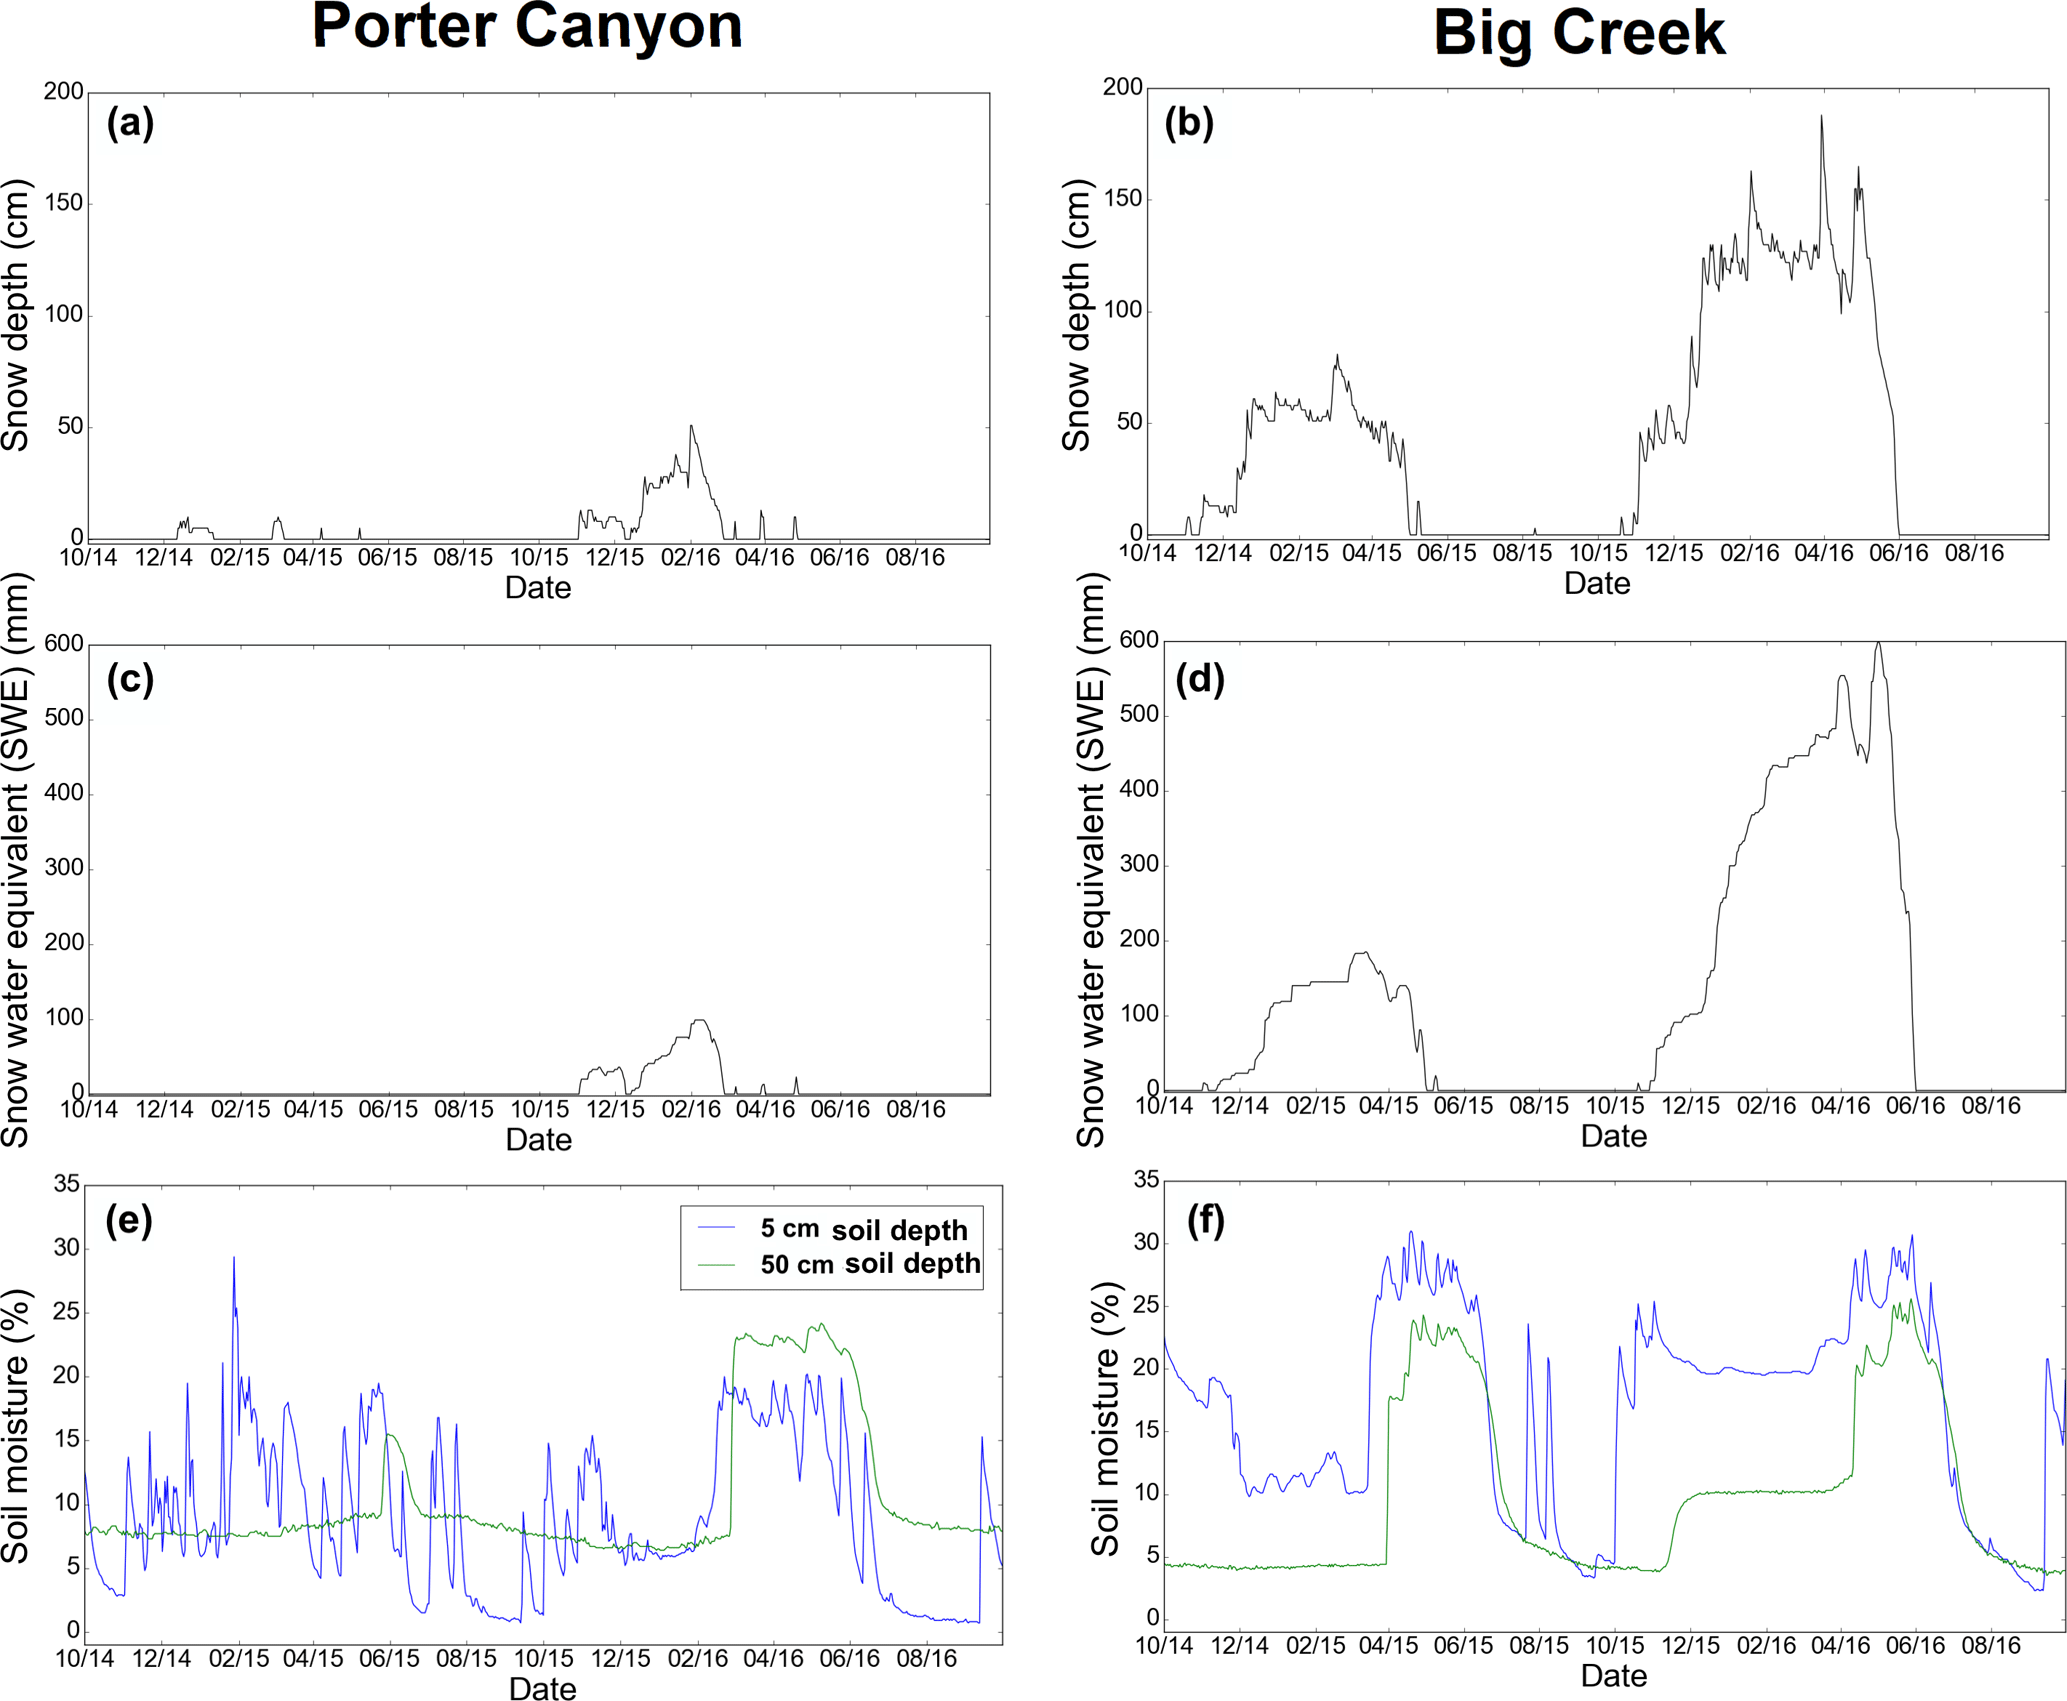
Figure 3(a, b) Snow depth, (c, d) snow water equivalent, and (e, f) soil moisture measured at Porter Canyon and Big Creek Snow Telemetry (SNOTEL) stations for water years 2015–2016, which were a drought year and a typical year, respectively.
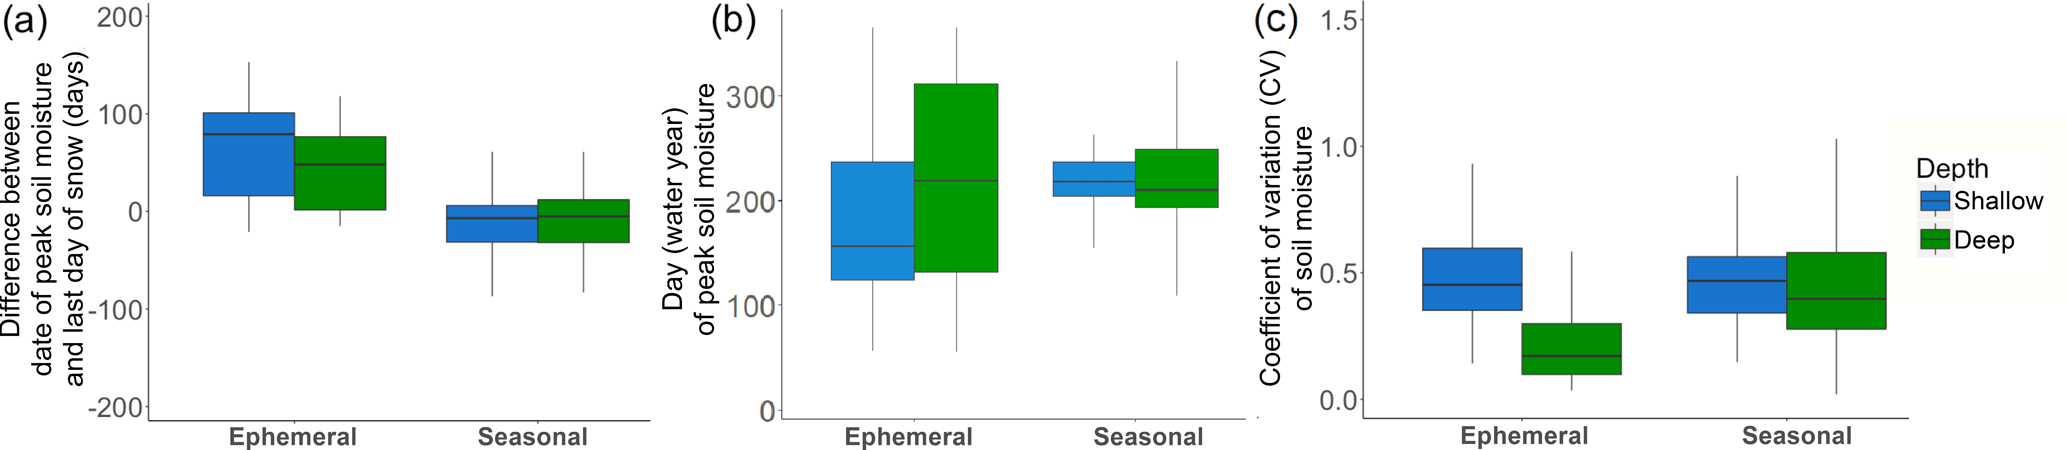
Figure 4(a) The difference between date of peak soil moisture and last day of snow (days) for shallow (5 cm) and deep (50 cm) soil moisture during water years 2014–2016 in Great Basin SNOTEL stations with ephemeral snow (50 site years) and seasonal snow (278 site years). (b) Day of peak soil moisture for SNOTEL and SCAN stations for shallow (5 cm) and deep (50 cm) soil moisture during water years 2014–2016. (c) The coefficient of variation (CV) for shallow (5 cm) and deep (50 cm) soil moisture during water years 2014–2016
Using similar records to those illustrated at these two sites, we use 328 site years (50 ephemeral and 278 seasonal site years) from all SNOTEL and SCAN sites in the Great Basin (Fig. 1) over water years 2014, 2015, and 2016 to illustrate the broader patterns of soil moisture response to ephemeral and seasonal snowmelt. We found that soil moisture following seasonal snowmelt reached a maximum 5 and 7 days prior to snow disappearance for shallow and deep soil moisture, respectively. This confirms previous findings that seasonal snowmelt drives coincident wetting and deeper water percolation (Harpold and Molotch, 2015; McNamara et al., 2005). In contrast, the median soil moisture peaked 79 and 48 days after of snow disappearance from ephemeral snowmelt for shallow and deep soil moisture, respectively (Fig. 4a). This is consistent with the peak shallow soil moisture occurring much earlier in the water year in shallow ephemeral snowmelt areas (Fig. 4b). The later deep soil moisture response in ephemeral areas reflects the lack of response, or low coefficient of variation, as compared to seasonal snowmelt (Fig. 4c). The lower CV for deep ephemeral snowmelt (0.2) compared to deep seasonal snowmelt (0.4–0.5) is indicative of reduced deep percolation and less water becoming available to groundwater and streamflow.
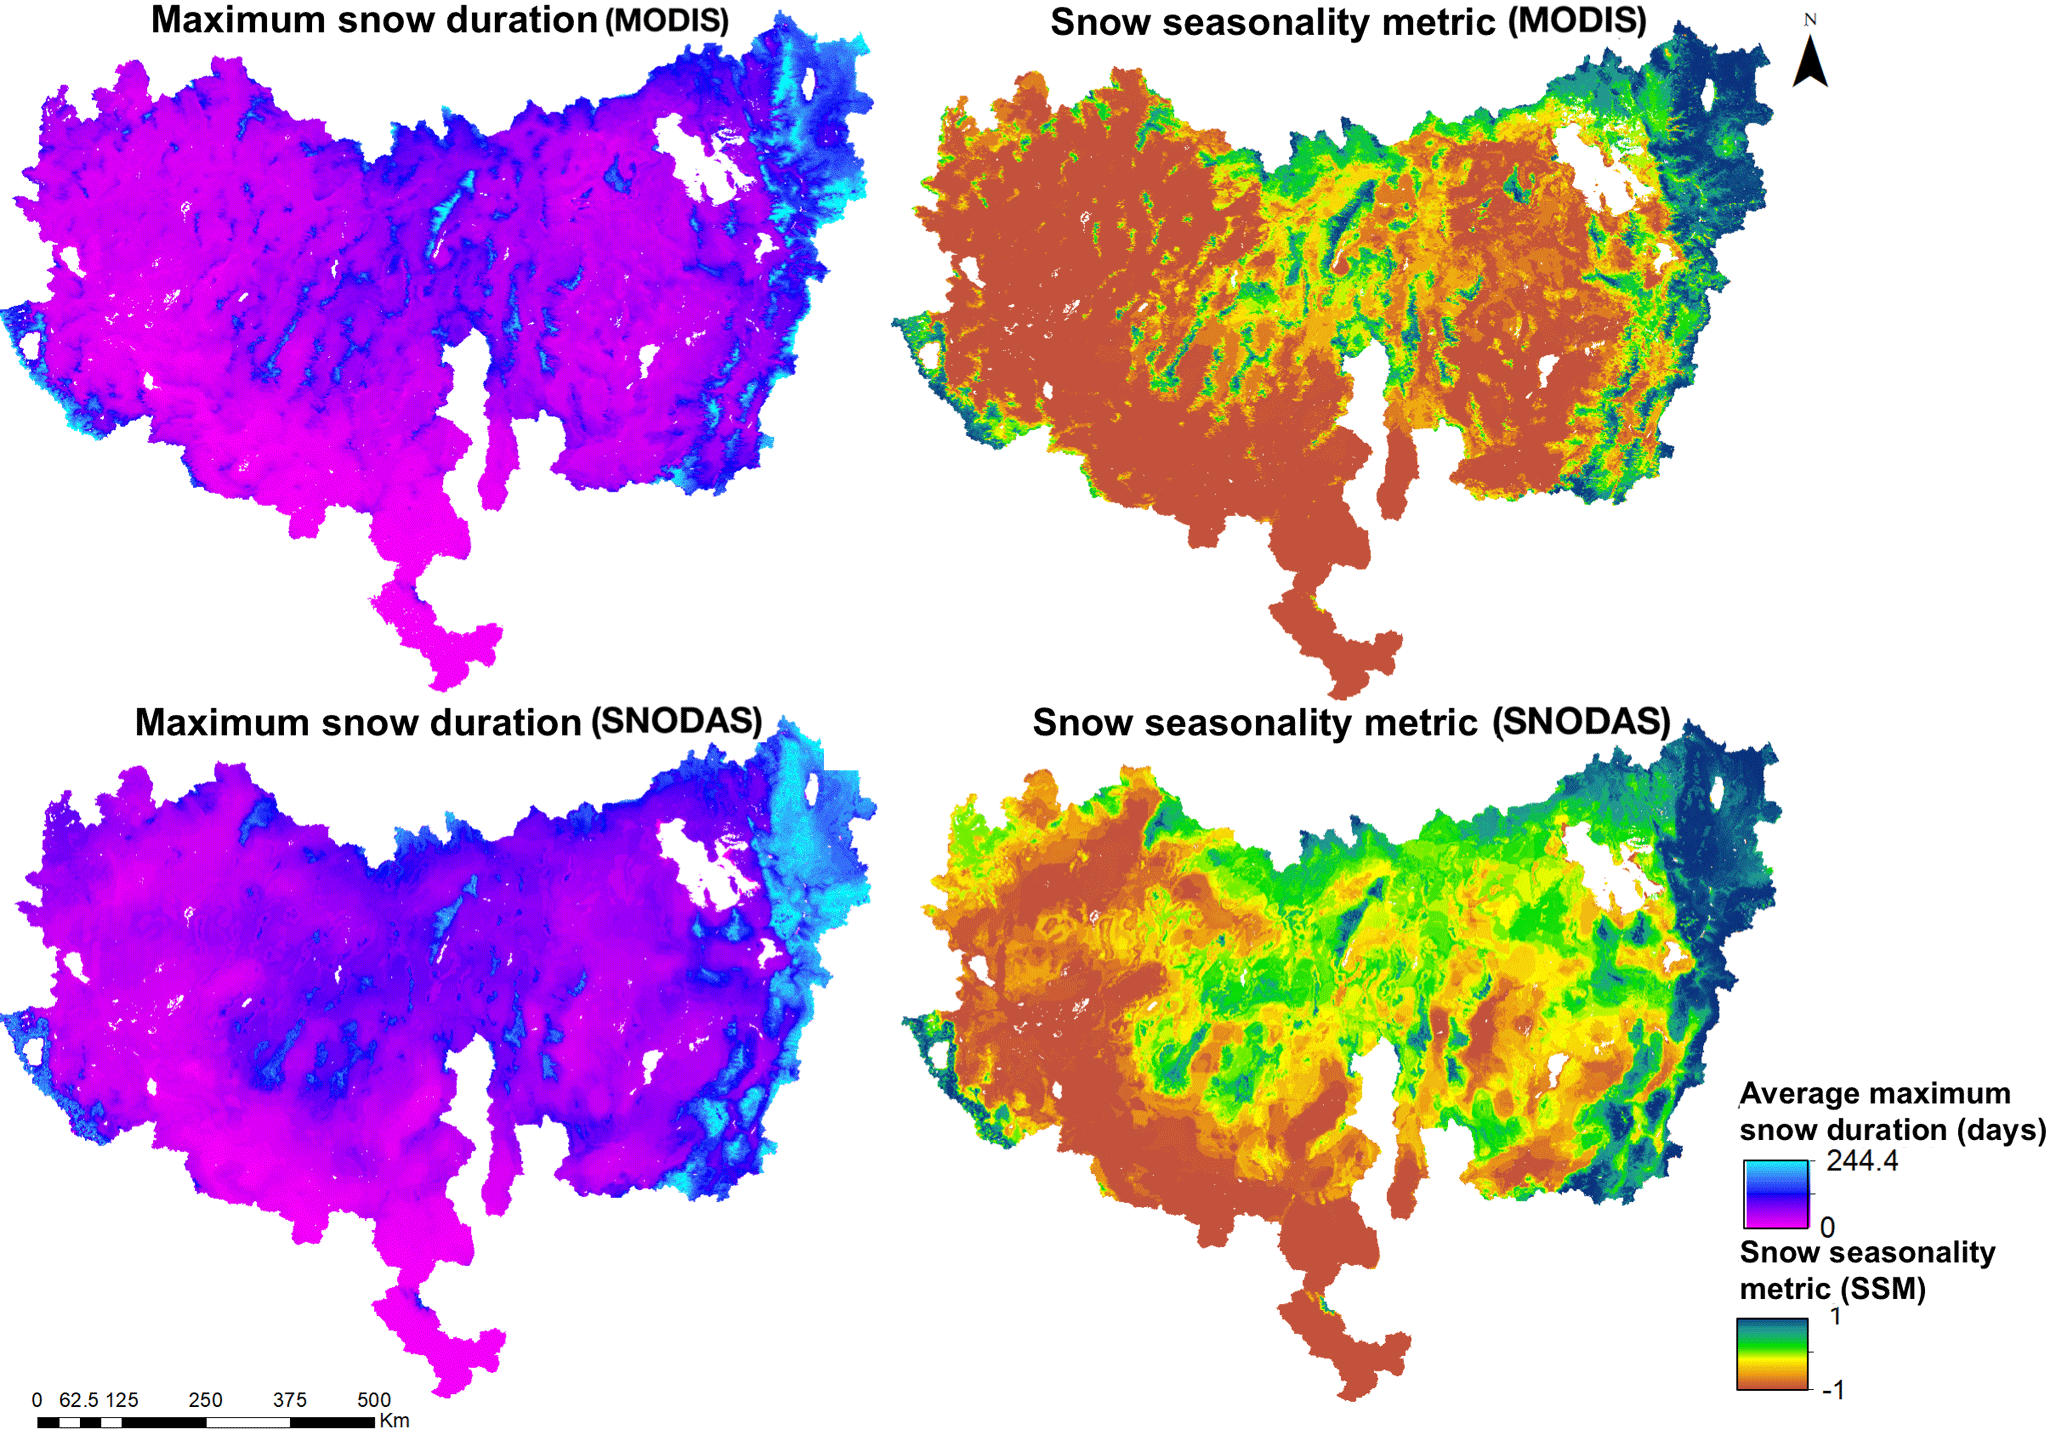
Figure 5The average maximum consecutive snow duration (maximum snow duration) and snow seasonality metric (SSM) for the Great Basin measured using MODIS and Snow Data Assimilation System (SNODAS) data in the Great Basin, USA, for water years 2005–2014.
The differences in soil moisture response between seasonal and ephemeral snowpacks across the Great Basin could have important consequences for vegetation phenology and runoff generation. For example, the timing of soil moisture is a strong control on the timing and amount of net ecosystem productivity (Inouye, 2008), with earlier snowmelt causing an earlier and longer growing season with reduced carbon uptake (Hu et al., 2010; Winchell et al., 2016). Harpold (2016) also showed that earlier snow disappearance generally led to more days of soil moisture below wilting point at SNOTEL sites. Our finding that soil moisture peaked earlier in ephemeral snowmelt than seasonal snowmelt is thus likely to be correlated with reduced vegetation productivity and increased late season water stress in many areas. In addition to stressing local vegetation, ephemeral snowmelt may reduce groundwater recharge and streamflow. For example, baseflow contributions to streamflow and overall water yield declined when snowmelt rates were smaller (Barnhart et al., 2016; Earman et al., 2006; Trujillo and Molotch, 2014), and overall water yields were lower in basins receiving more rain and less snow (Berghuijs et al., 2014). Changes in percolation patterns also affect the distribution of more shallow rooting plants versus deeper rooting plants that need long duration soil moisture pulses to grow and reproduce (Schwinning and Sala, 2004). These differences in how ephemeral versus seasonal snowmelt affects soil moisture provide a strong motivation to understand the distribution and causes of ephemeral snowpacks across the Great Basin.
4.2 Topographic controls on snow seasonality
In a typical year, much the Great Basin experiences ephemeral snow (Fig. 5) that can only be comprehensively observed with remote sensing platforms because of the lack of standard ground stations (Fig. 1). Using MODIS imagery, there are two new metrics to estimate snow ephemerality with daily snow cover products: (1) the maximum consecutive snow duration and (2) the snow seasonality metric. The SSM describes both the consecutive snow season length and shoulder-season ephemerality. A SSM value <1 means an area experiences at least one ephemeral snow event. The average SSM was −0.4 (Fig. 5), suggesting that on average the Great Basin was dominated by ephemeral snow extent. Maximum consecutive snow duration can be compared to the Sturm et al. (1995) 60-day threshold for ephemeral snow, as done in this case, but it is flexible enough to include a threshold of any day length. The average maximum consecutive snow duration in the Great Basin from MODIS data was 42.1 days (Fig. 5). We found higher estimates of the average maximum consecutive snow duration measured using SNODAS of 62.9 days but a similar average SSM of −0.4 (Fig. 5). While the maps of the two products tend to produce similar results (Fig. 5), the SNODAS spatial patterns often miss finer-scale topographic controls (e.g., Wasatch mountains in the far eastern Great Basin) and overestimates snow durations in the colder, lower elevations (e.g., basins below the Ruby Mountains in the central Great Basin). In general, SNODAS overestimates snow duration in areas with the longest and shortest snow durations, i.e., highest and lowest elevations (Fig. 6). In these critical water supply areas >2500 m, where snow would persist for >150 days according to MODIS, the SNODAS estimates were often biased by >50 days (Fig. 6). We explore the challenges of coarse, physically based models, such as SNODAS, later in this paper.
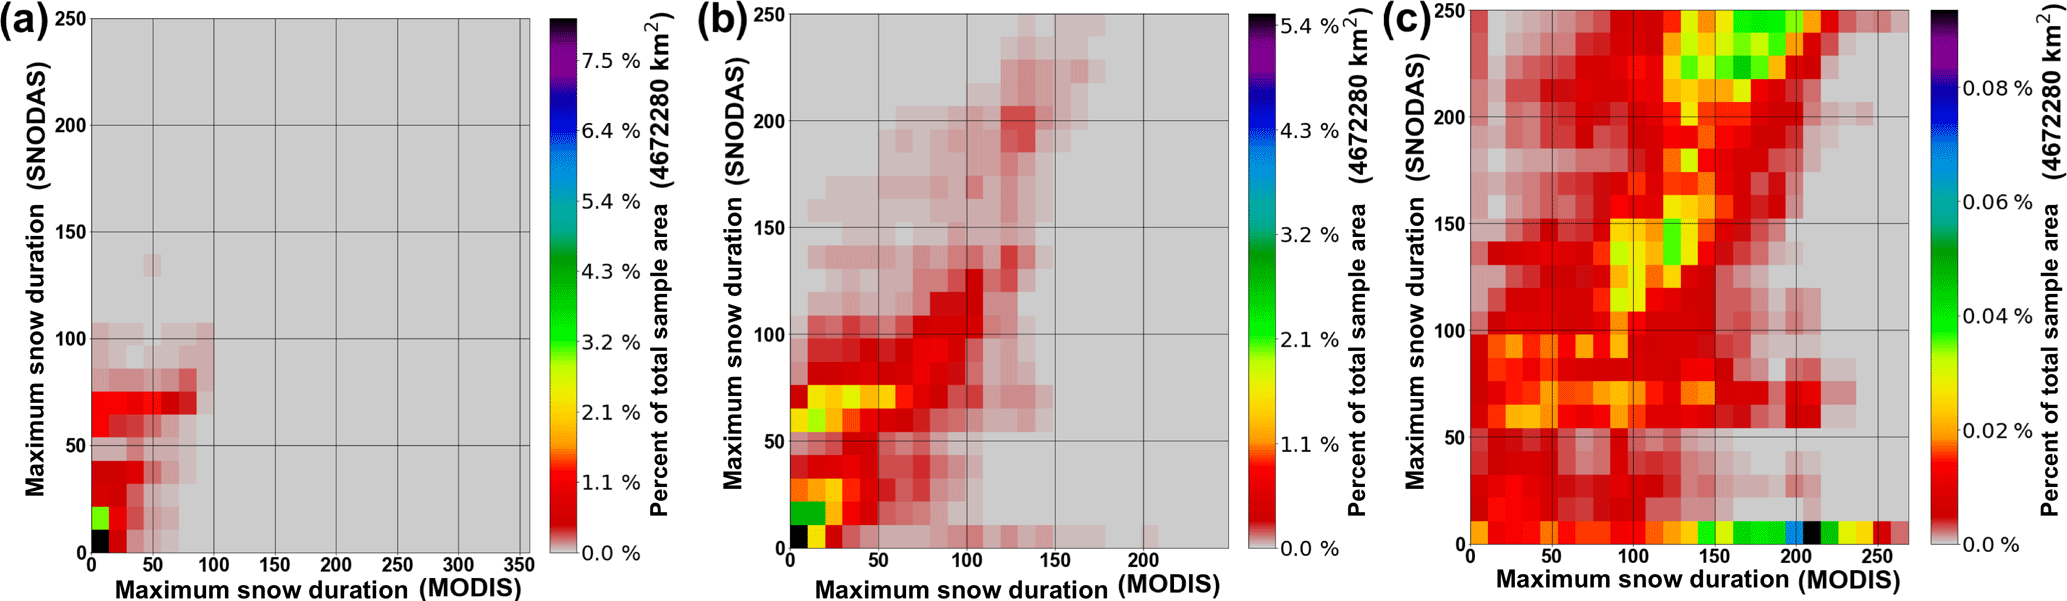
Figure 6Maximum consecutive snow duration (maximum snow duration) measured using MODIS and Snow Data Assimilation System (SNODAS) data at (a) low elevations (0–1500 m), (b) medium elevations (1500–2000 m), and (c) high elevations (2000 m +).
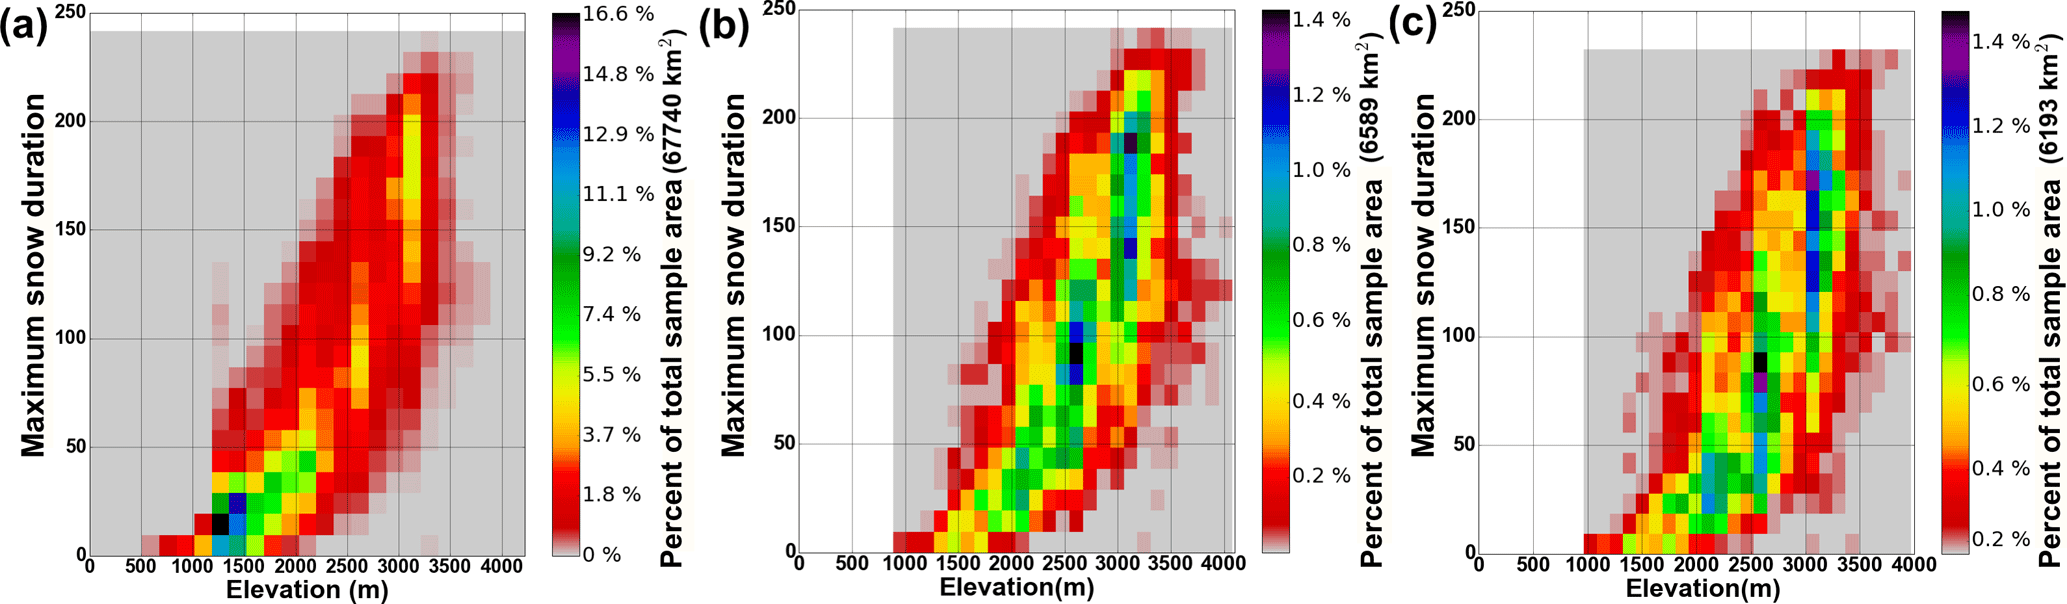
Figure 7Heat maps of the relationship between elevation and average maximum consecutive snow duration (maximum snow duration) from MODIS at (a) all slopes, (b) north-facing slopes only, and (c) south-facing slopes only in the Great Basin, USA. North facing was defined as northness >0.25 and south facing was defined as northness . Color bar scale is different in panel (a), reflecting the much larger area at low elevation.
We investigate elevation and aspect as proxies for snowpack mass and energy dynamics in order to expand our understanding of snow ephemerality. Elevation is a primary control on near-surface air temperature due to the adiabatic lapse rate (Bishop et al., 2011; Greuell and Smeets, 2001; Nolin and Daly, 2006). Prior research has found that there is a strong elevation dependence on snowmelt timing, runoff generation, snow water equivalent, and snow season length (Hunsaker et al., 2012; Jefferson, 2011; Jost et al., 2007; Molotch and Meromy, 2014). Elevation effects are likely due to a variety of factors, including temperature controls on the rain–snow transition, longwave radiation in cloudy areas, and sensible heat flux. Aspect is often a secondary control on snow distributions because it influences incoming shortwave radiation (Jost et al., 2007; Pomeroy et al., 2003) and wind patterns (Knowles et al., 2015; Leathers et al., 2004; Winstral et al., 2013). Shortwave radiation is the primary driver of ablation via melt and sublimation (Cline, 1997; Marks and Dozier, 1992).
Dividing the Great Basin into low elevations (<1500 m), mid-elevations (1500–2500 m), and high elevations (>2500 m) illustrated elevation's dominant role on snow cover duration (Fig. 7). Across the Great Basin, 96.2 % of the low-elevation area and 75.2 % of the mid-elevation area had a maximum consecutive snow duration of <60 days. Conversely, only 10.5 % of high elevations had a maximum consecutive snow duration of <60 days (Fig. 7). The results suggest that mid- and low elevations of the Great Basin are more likely to be ephemerally dominant. The heat maps also illustrate that elevation alone is not a strong predictor of maximum consecutive snow cover days (Fig. 7). We use three smaller mountain ecoregions (Fig. A1) to illustrate variability in elevation effects (Fig. 8). There were similar average maximum snow duration values in the Ruby Mountains (Fig. 8a), eastern Sierra Nevada (Fig. 8b), and western Wasatch–Uinta ecoregion (Fig. 8c) (107, 100, and 95 days, respectively). However, snow in the Ruby Mountains persisted longer than the Sierra Nevada and Wasatch–Uinta ecoregions. The Sierra Nevada ecoregion had a weaker relationship between snow persistence and elevation above 2500 m, while the Wasatch–Uinta ecoregion had a weaker relationship with elevation below 2500 m (Fig. 8). These differing relationships between maximum snow duration and elevation suggest other factors are affecting snow ephemerality.
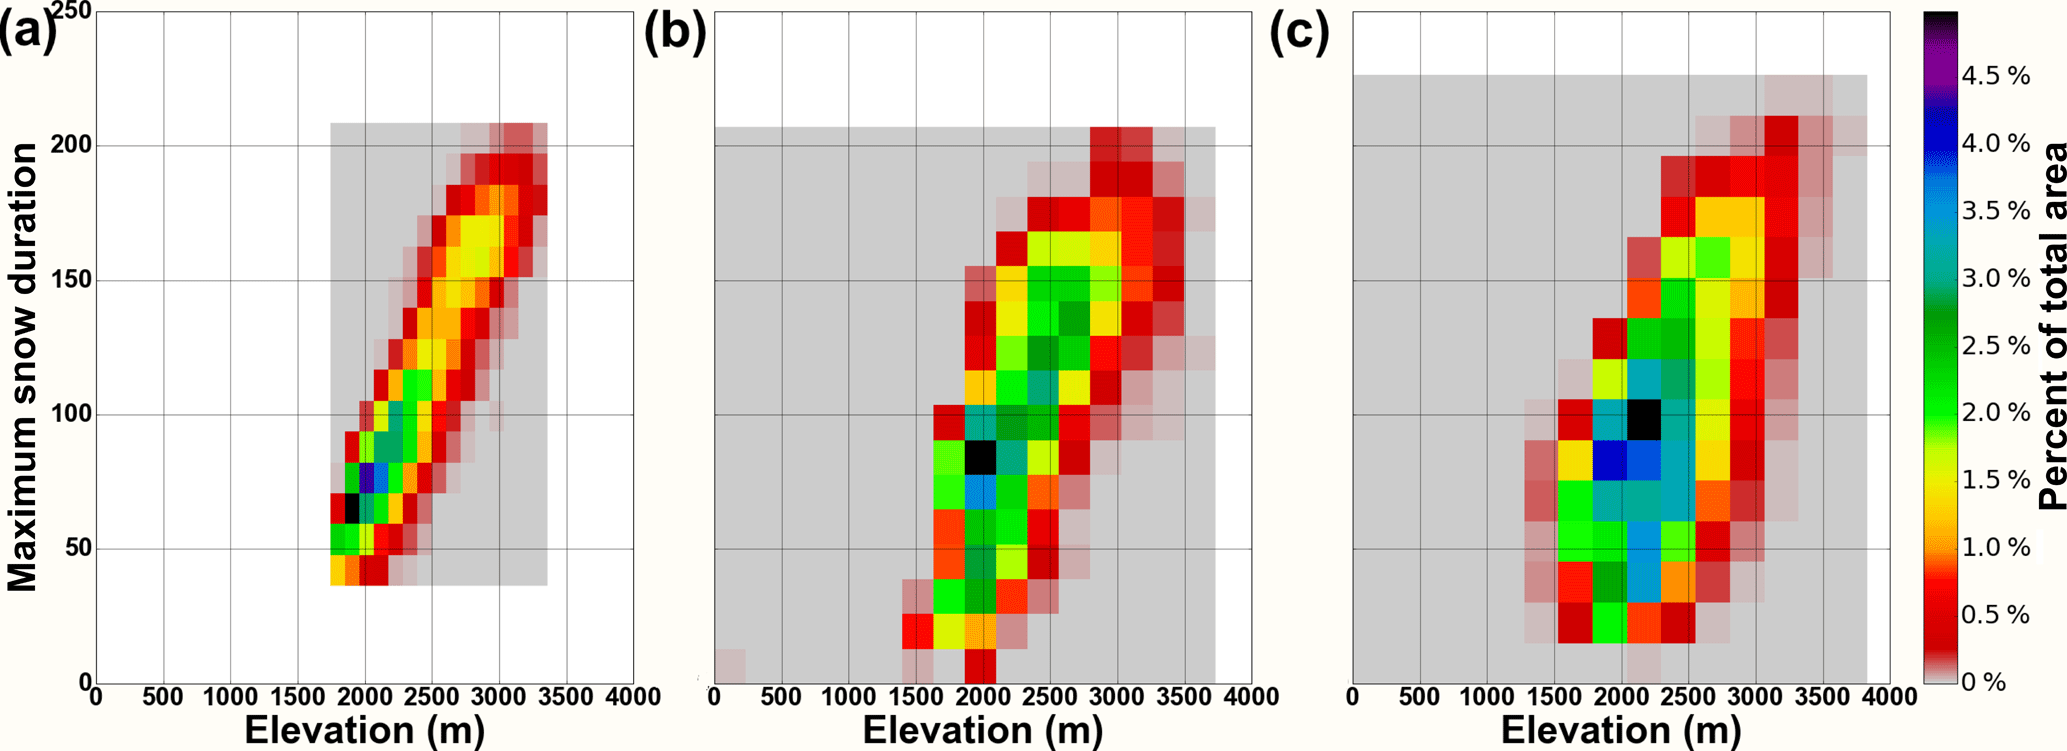
Figure 8Heat maps showing the relationship between elevation and average maximum consecutive snow duration (maximum snow duration) for three seasonally dominant ecoregions in the Great Basin: (a) the Ruby Mountains, (b) the Sierra Nevada mountains, and (c) the Wasatch–Uinta Mountains.

Figure 9Heat maps of the relationship between aspect and average maximum consecutive snow duration (maximum snow duration) at (a) low elevations (0–1500 m), (b) medium elevations (1500–2500 m), and (c) high elevations (2500 m+).
Aspect is also an important control on snow seasonality in the Great Basin, but its importance is limited to mid- and high elevations. We find that there are shorter maximum snow durations in south-facing aspects at elevations >1500 m (Fig. 9). At low elevations, the difference in average maximum snow duration between north- and south-facing slopes was 0.4 days, while for mid- and high elevations, it was 2 and 5 days, respectively (Fig. 9). This is consistent with aspect strongly controlling solar radiation, which is the main energy input to the snowpack. This suggests that deeper, high-elevation snowpacks ablate in response to greater solar radiation and corresponding warmer temperature on south-facing hillslopes (Hinckley et al., 2014; Kormos et al., 2014). In contrast, lower-elevation areas appear to have maximum snow duration caused by factors other than aspect. This is consistent with the outsized importance of other energy fluxes and factors, like ground heat flux and rain–snow transition elevation, that are not captured by aspect and elevation (Figs. 7, 8 and 9).
Table 1Average winter (1 December–1 April) temperature (∘C) and average elevation (m) for both dominant mechanisms of snow ephemerality and seasonal snow from 2009 to 2014 in the Great Basin.
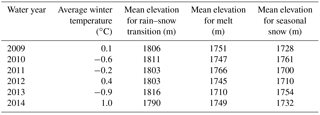
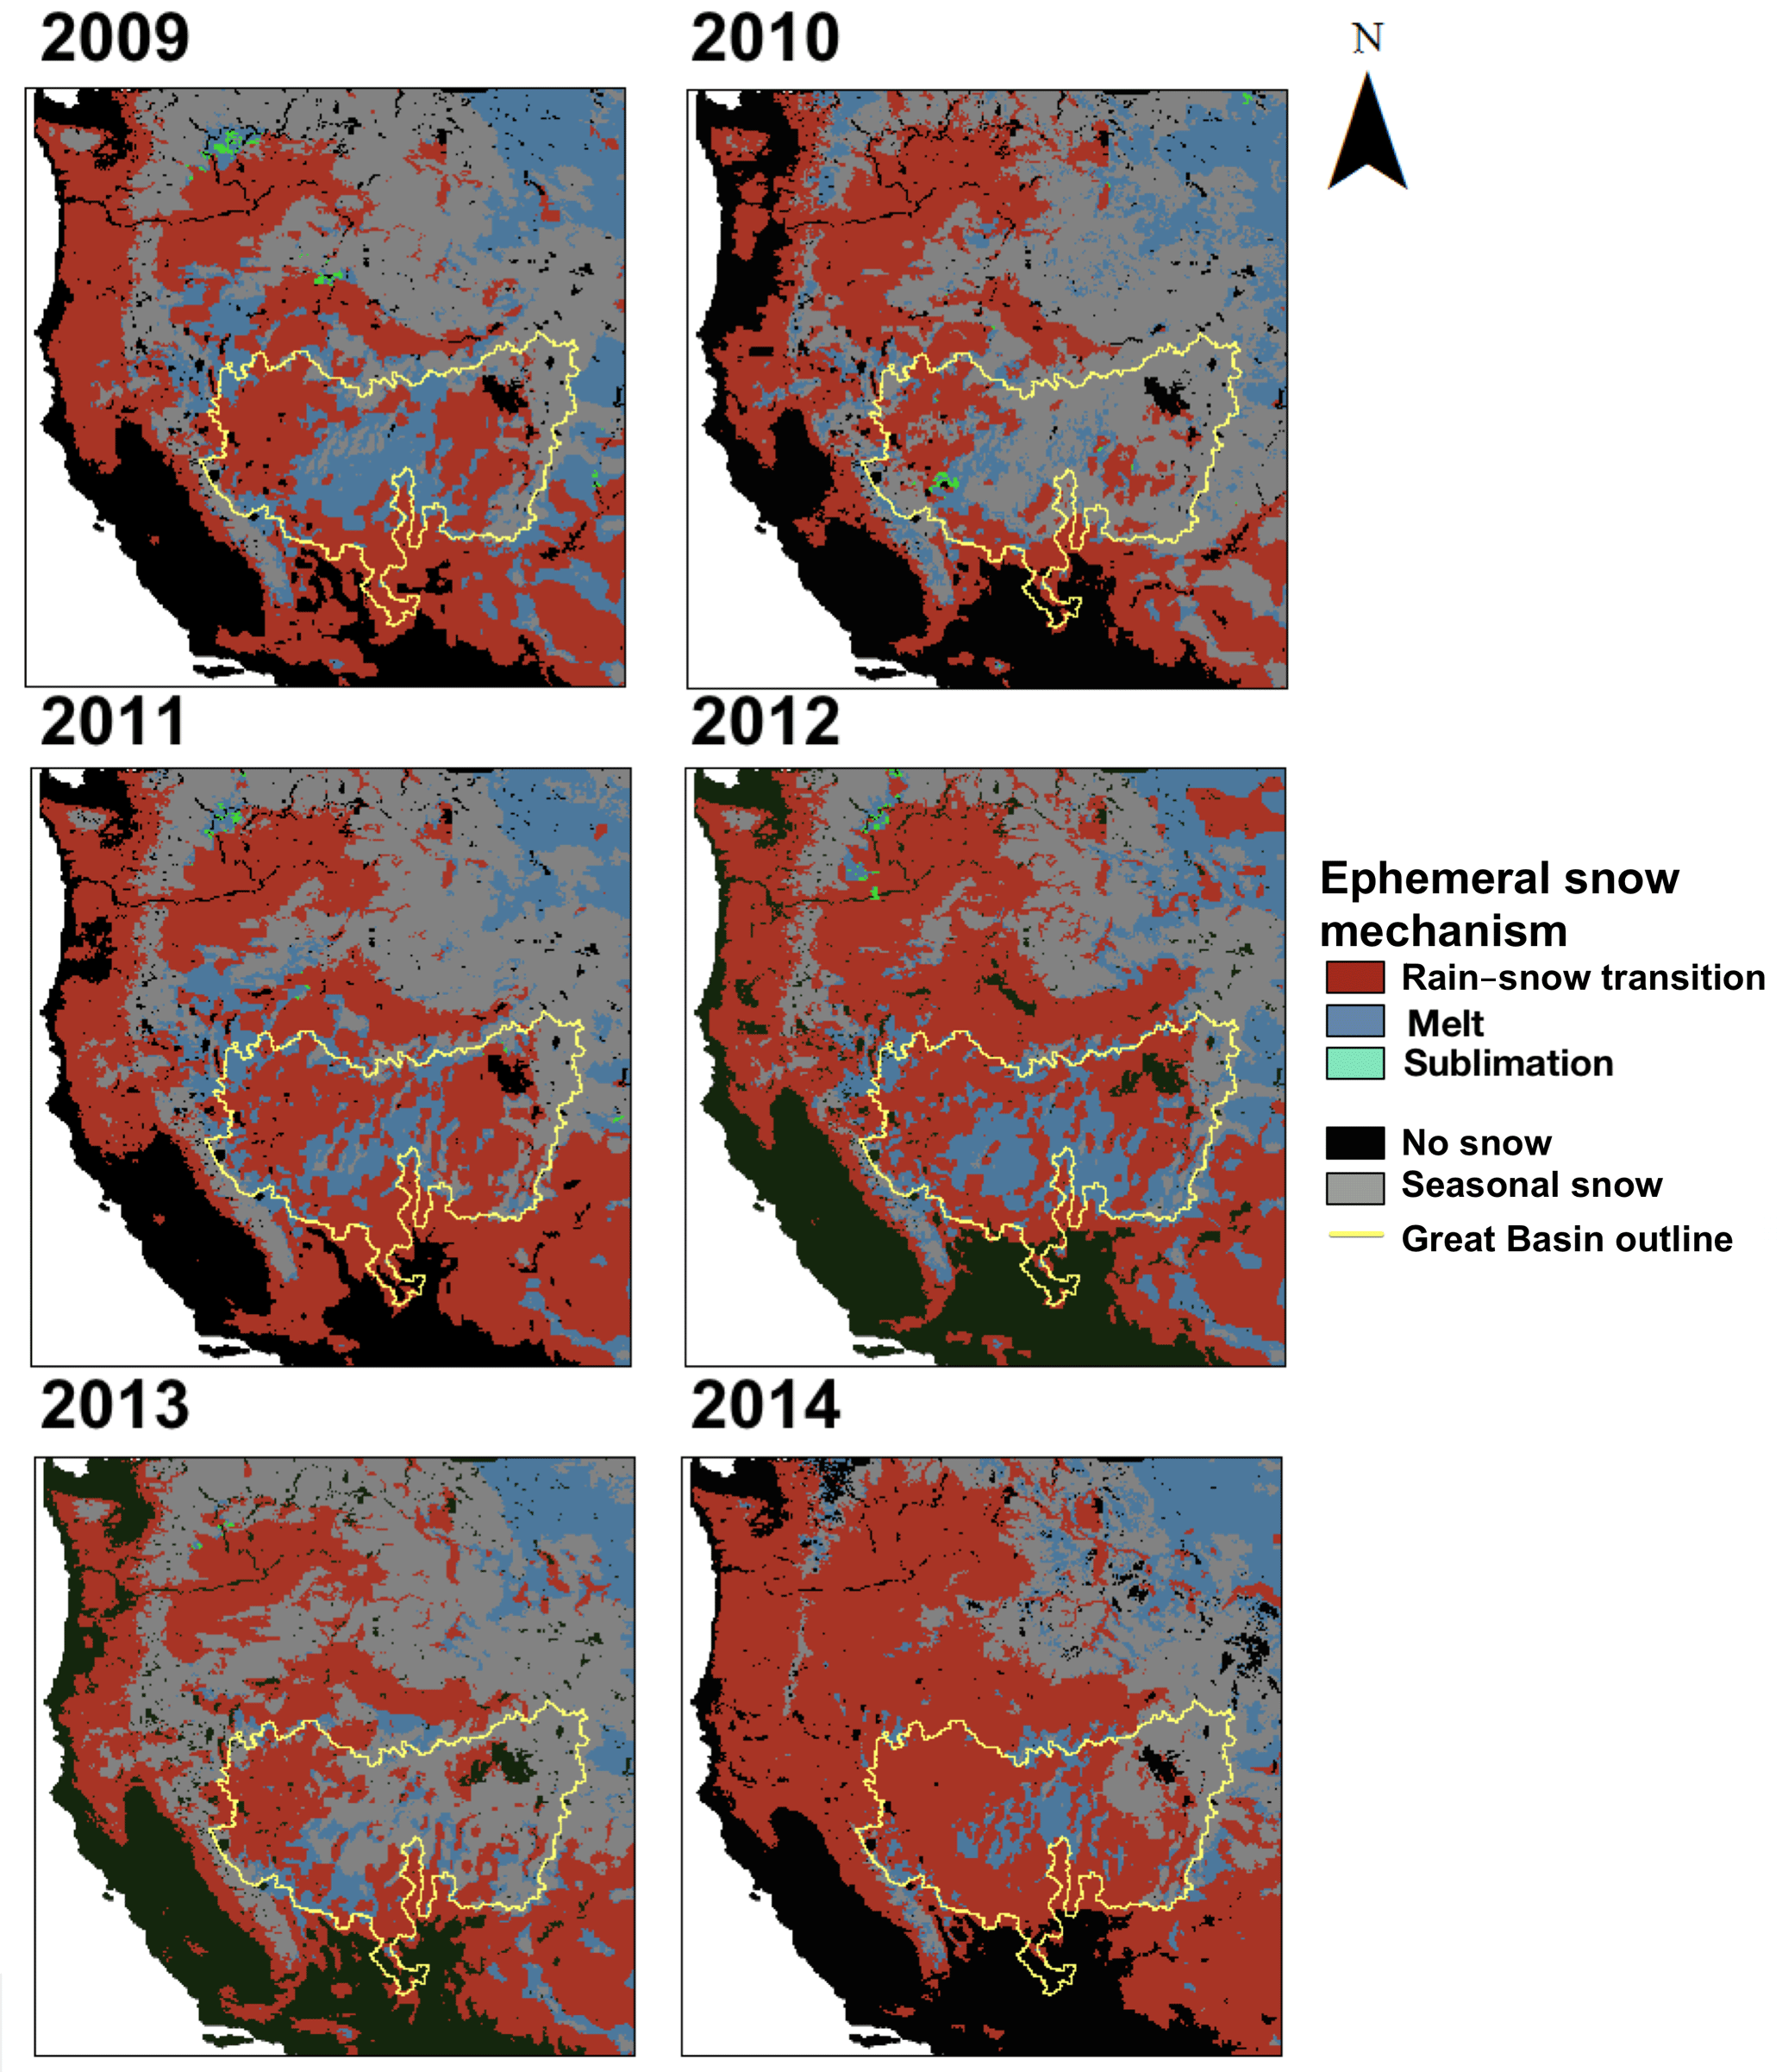
Figure 10Dominant mechanisms for snow ephemerality from water years 2009–2014 in the western United States. Areas with seasonal snow (grey), no snow (black), and water bodies (black) are also depicted. The Great Basin region is outlined in yellow.

Figure 11Histograms of the relationship between elevation and the dominant mechanisms for snow ephemerality in the Great Basin from water years 2009–2014.
4.3 Proximate mechanisms controlling snow ephemerality
We propose a three-mechanism classification scheme to help frame our understanding of snow ephemerality: (1) rain–snow transitions limit snow accumulation, (2) snowpack ablation from melt and sublimation, and (3) wind scour or redistribution. Probably the most explored and observed mechanism is the potential for rising rain–snow transition elevations to limit snow accumulation and duration (Bales et al., 2006; Klos et al., 2014; Knowles and Cayan, 2004; Mote, 2006). Reduction in snow duration can also be caused by the melt of snowpack (Mote, 2006) and losses from sublimation (Harpold et al., 2012; Hood et al., 1999); however, much less is known about the role and distribution of these processes outside of the seasonal snowpack zone. Finally, wind scour can reduce snowpacks by redistributing it to other areas or by increasing blowing wind sublimation (Knowles et al., 2015; Leathers et al., 2004).
We chose 6 years to evaluate the dominant mechanisms causing snowpack ephemerality using a new classification system (Fig. 2) based on SNODAS data that compared favorably to estimates from MODIS (Figs. 5 and 6). In that 6-year period, the year with the lowest average winter (1 December to 1 April) temperature using gridded meteorological (GRIDMET) 4 km resolution surface temperature estimates was 2013 at −0.9 ∘C, while the year with the highest average winter temperature was 2014 at 1.0 ∘C (Abatzoglou, 2012; Table 1). In water year 2013 and water year 2010, the two coldest years, seasonal snowpacks were dominant in most of the Great Basin and western United States (Figs. 10–11). In the coldest years of 2010 and 2013, the rain–snow transition and melt caused ephemerality to shift lower in elevation (Fig. 11). In the warmest year of 2014, seasonal snowpack was lowest at lower elevations throughout the western US mountain ranges (Fig. 10), including the Great Basin where the increase in ephemeral snowpacks at higher elevations was due primarily to a rain–snow mechanism (Figs. 10 and 11). Melt-caused snow ephemerality also increased in the warm 2014, but ephemeral snow remained sparse above 2500 m in all years. Overall, our findings are consistent with the importance of variability in rain–snow transition elevations limiting snow accumulation and duration (Bales et al., 2006; Klos et al., 2014; Knowles and Cayan, 2004; Mote, 2006). Sublimation was only present as a limiting mechanism in 2010 and only for a small area (Fig. 10). Blowing snow sublimation was not the dominant cause of snow ephemerality in the Great Basin for any year; SNODAS struggles to represent wind redistribution of snow (Clow et al., 2012; Hedrick et al., 2015). Our approach to classify proximate causes of snow ephemerality has some limitations. Namely, it assigns only a single mechanism to each grid cell when there could be multiple mechanisms. Moreover, the method cannot consider changes in the mechanisms with time (e.g., melt tends to occur more in spring) because we applied annualized estimates of snow cover duration and concerns about the fidelity of the SNODAS model at short timescales.
The mechanisms causing snow ephemerality that can be inferred from the SNODAS model have important implications for water availability in the Great Basin, but there is less confidence in the model fidelity in these shallow snowpacks given their differences with the MODIS observations (Fig. 6). These limitations are present in all snowpack energy models because the models were developed for deeper snowpacks where terms like ground heat flux and albedo depth relationships can be ignored or are insensitive (Cline, 1997; Harstveit, 1984; Liang et al., 1994; Slater et al., 2017; Tyler et al., 2008). In shallow snowpacks, these terms are more critical (Hawkins and Ellis, 2007; Slater et al., 2017; Tyler et al., 2008; Şensoy et al., 2006), and the lack of SWE means the internal energy state of the snowpack (i.e., cold content) is more easily varied by short-term climate forcing (e.g., warm, sunny days) (Liston, 1995). Ephemeral snowpacks also exist at lower elevations with warmer soils and increased ground heat flux (Slater et al., 2017; Tyler et al., 2008). Uncertainty in the rain–snow transition principally arises from predicting climate forcing and in particular temperature and humidity in places like the Great Basin (Harpold et al., 2017a). However, the underlying phase prediction method and related model decisions and climate forcing data can also be important for the quality of precipitation phase prediction (Harpold et al., 2017b). Further complicating rain–snow transition mechanisms is the storage or drainage of liquid water on existing snowpacks (Lundquist et al., 2008; Marks et al., 2001). Although SNODAS assimilates MODIS imagery into the model, it does not appear to capture the finer elevation patterns we found using the MOD10A product (Figs. 5 and 6) and, in particular, seemed to overestimate consecutive days of snow cover. Part of the challenge at higher elevations is modeling blowing snow patterns over 1 km grid cells, which gives consistent lower accuracy of SNODAS above the tree line and in more windy areas (Clow et al., 2012; Hedrick et al., 2015). The Great Basin shows tremendous variability in snow ephemerality caused by interactions of topography, elevation, and prevailing wind (Figs. 10–11) and, thus, represents an area where improvements in the physically based modeling will be critical to predicting snow water resources under a variable and changing climate.
Mapping, measuring, and modeling ephemeral snow is challenging with current techniques, but it is vital for understanding future water resources and vegetation water use. Ephemeral snowpacks do not have distinct accumulation and ablation periods, which means the timing of soil moisture input varies and is more challenging to predict than seasonal snowmelt (e.g., McNamara et al., 2005). Consequently, as snowpacks shift from seasonal to ephemeral, there are potential ecohydrological consequences such as changes to vegetation response, vegetation distribution, drainage, lateral water flow, and solute transport. Our work shows that, while topography and climate variability have strong controls on the distribution of ephemeral snowpacks (Figs. 7 and 10), those factors will not be sufficient for predicting snow ephemerality under varying climate. Instead, there is a need for physics-based models capable of capturing the three broad mechanisms identified by this study: (1) rain–snow transitions limit snow accumulation, (2) snowpack ablation from melt and sublimation, and (3) wind scour and redistribution. These classifications could help better identify local and regional sensitivity to increased snow ephemerality (Figs. 10 and 11). This work has also highlighted major weaknesses in the observational infrastructure, data analysis, and modeling techniques needed to support the growing importance of ephemeral snowpacks in the Great Basin. In light of these diverse needs, we conclude with a short summary of recommendations meant to guide future research directions.
-
Improving and standardizing snow ephemerality metrics: our research suggests there is a snow duration threshold where snowpack and soil moisture patterns begin to resemble seasonal instead of ephemeral snowmelt and perhaps a second threshold when they begin to resemble rain (Fig. 3). Yet evidence that this threshold is near the 60 days used in Sturm et al. (1995), or consistent across space, is lacking. Instead of using this arbitrary 60-day threshold, it is recommended that future research use the snow properties and soil moisture response of ephemeral snowpacks combined with a sensitivity analysis to create a snow duration threshold capable of differentiating seasonal and ephemeral soil moisture response (e.g., McNamara et al., 2005).
-
Increasing snow and soil moisture observations in ephemeral areas: in the Great Basin, only 2 Snow Telemetry stations and 26 Soil Climate Analysis Network stations observe ephemeral snowpacks (Fig. 1). The lack of observations makes it more difficult to develop relationships between snowmelt and soil moisture. To help develop better criteria for categorizing snowpack as ephemeral, we need more snow and soil moisture observations in ephemeral areas. Also, observing both shallow and deep soil moisture can add significant hydrological inferences. We can then also use these observations to verify results derived from remote sensing and physically based models.
-
Improved remote sensing algorithms: there is no consistent standard for defining the length of the snow-covered period. It is still common for papers to define the length of a snow-covered period by the first and last days of snow cover. This approach does not account for short-term snow disappearance between those days. Approaches that report the total number of snow-covered days miss information contained during shown snow-free periods. Additionally, there is no consistent algorithm for accounting for cloud cover and that may make these types of methods infeasible for some regions. More widespread use of the object-oriented techniques, like the one used in this study, is needed to evaluate their efficacy and accuracy across differing regions and snow regimes.
-
Improved spatial resolution and fidelity of snow and climate data: the MOD10A data product has a spatial resolution of 500 m. The coarse resolution made it difficult to verify our ephemeral snow results with SNOTEL observations that use 3 m wide snow pillows. Topographic complexity leads to variations in climate on much finer resolutions than the 4000 m gridded meteorology data used for this analysis. Gridded snow and climate data should have a spatial resolution more consistent with the variability in snowpacks on the order of 10–100 m. While very fine resolution climate datasets are beginning to be produced, there is a large need to merge existing remote sensing snow observations into a data product that maximizes the current space and time resolutions across different remote sensing platforms (e.g., the spatial resolution of Sentinel 2 but the temporal resolution of MODIS).
-
Improved physics-based modeling: identifying weaknesses in physically based models was not the objective of this study; however, it is clear this is a need for better prediction of snow ephemerality. Improving model parameterization of ground heat flux and ensuring the temporal model resolution is sufficient to capture rapid changes in cold content are two ways to improve these models. These improvements are contingent on new and better observations of mass and energy fluxes to support greater model fidelity in ephemeral snow.
The data used in this paper are available in Petersky and Harpold (2018).
Figure A1 is an elevation map of the Great Basin, USA, showing key ecoregions and major cities. Figure A2 is a map of average winter (1 December–1 April) temperature, precipitation, and radiation across water years 2001–2015. Figure A3 shows how the measured number of ephemeral and seasonal snow events at SNOTEL sites corresponded to the number derived from the ephemeral snow algorithm. Figure A4 shows how the 30 % snow fraction was chosen using a sensitivity analysis.

Figure A1Map of the Great Basin region, USA, as defined by the USGS HUC Region 16 along with major cities and mountain ranges. The Sierra Nevada, Ruby, and Wasatch–Uinta mountain ranges are highlighted.
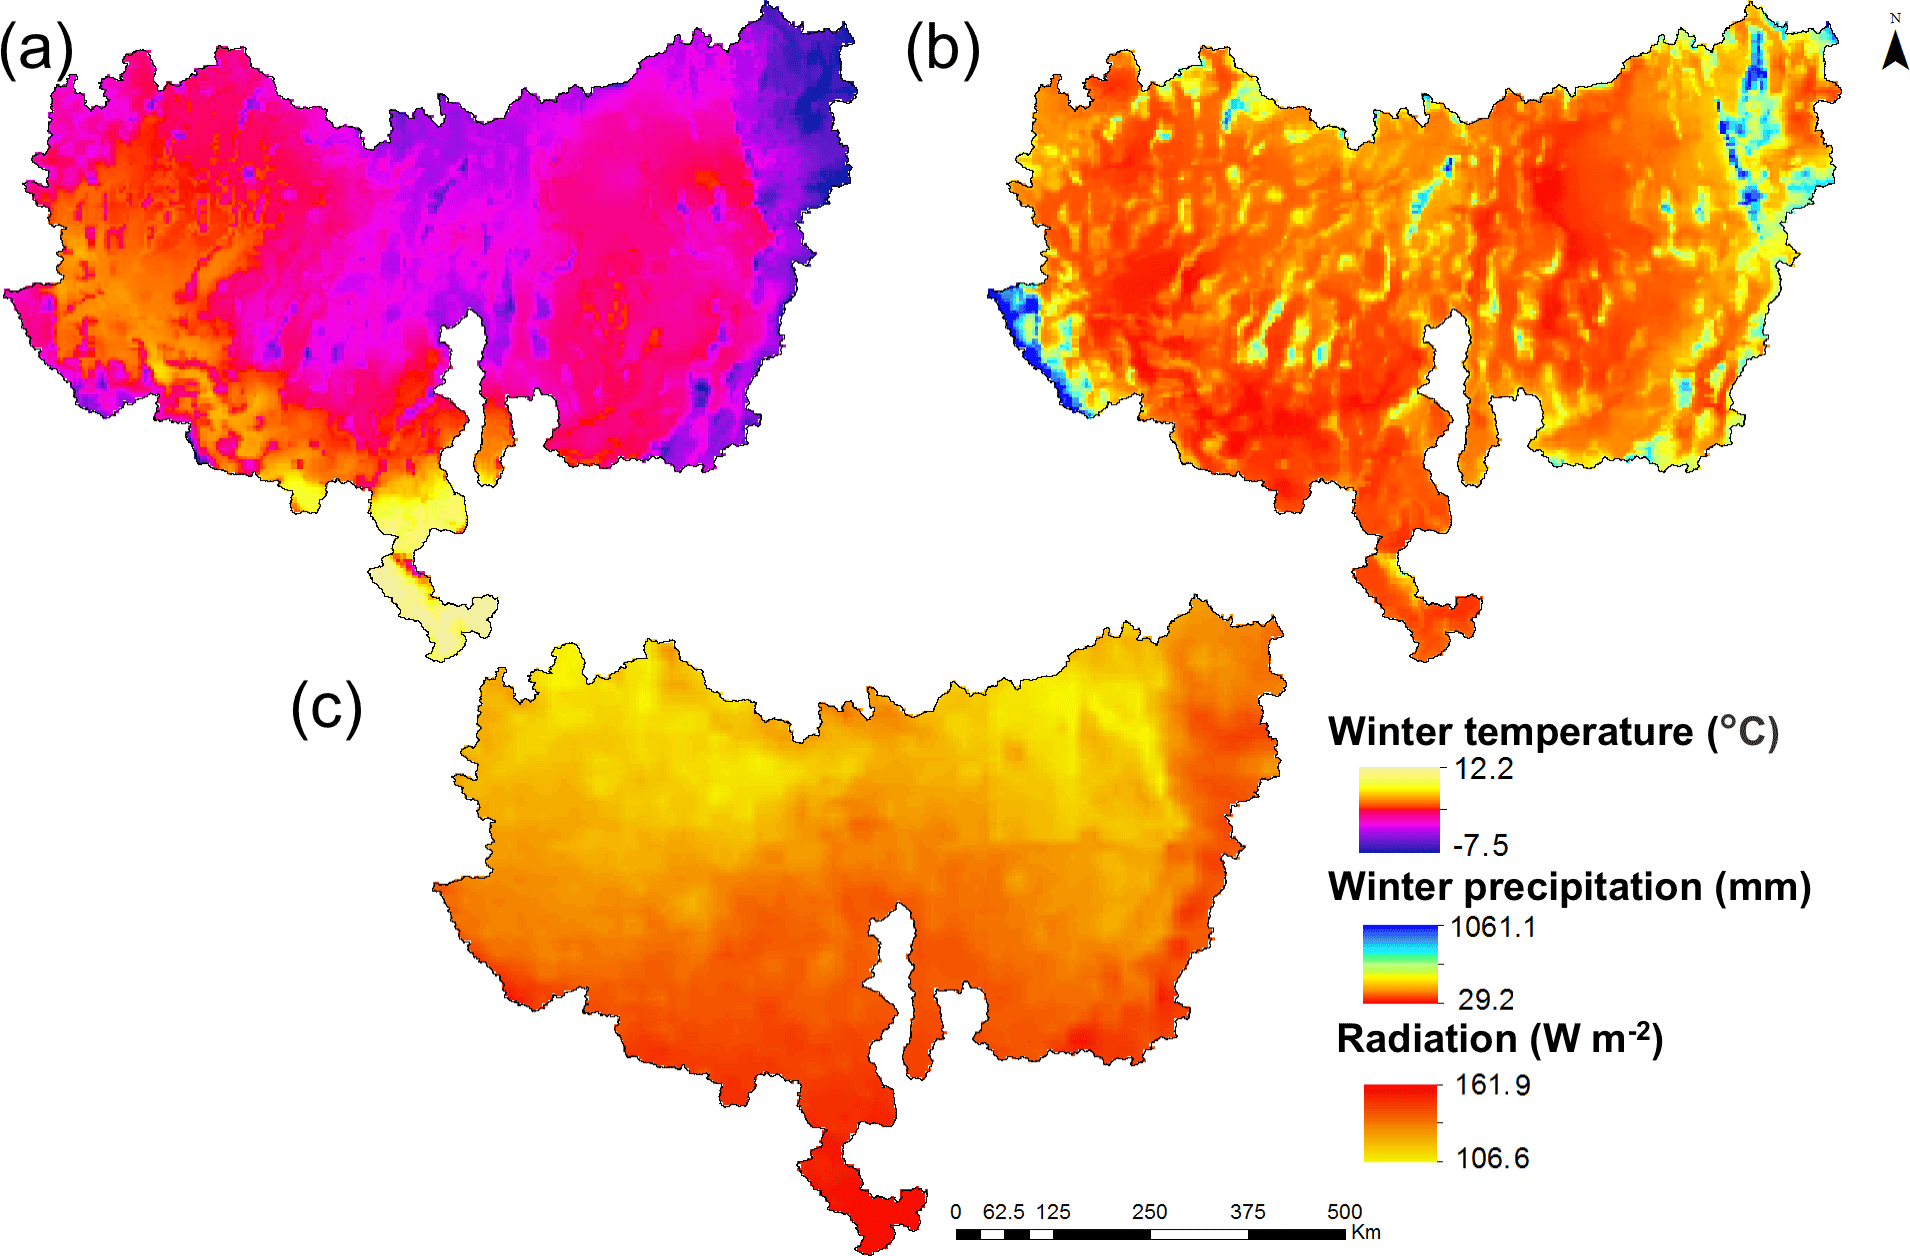
Figure A2(a) Average winter temperature, (b) average winter precipitation, and (c) average winter radiation across water years 2001–2015 in the Great Basin.
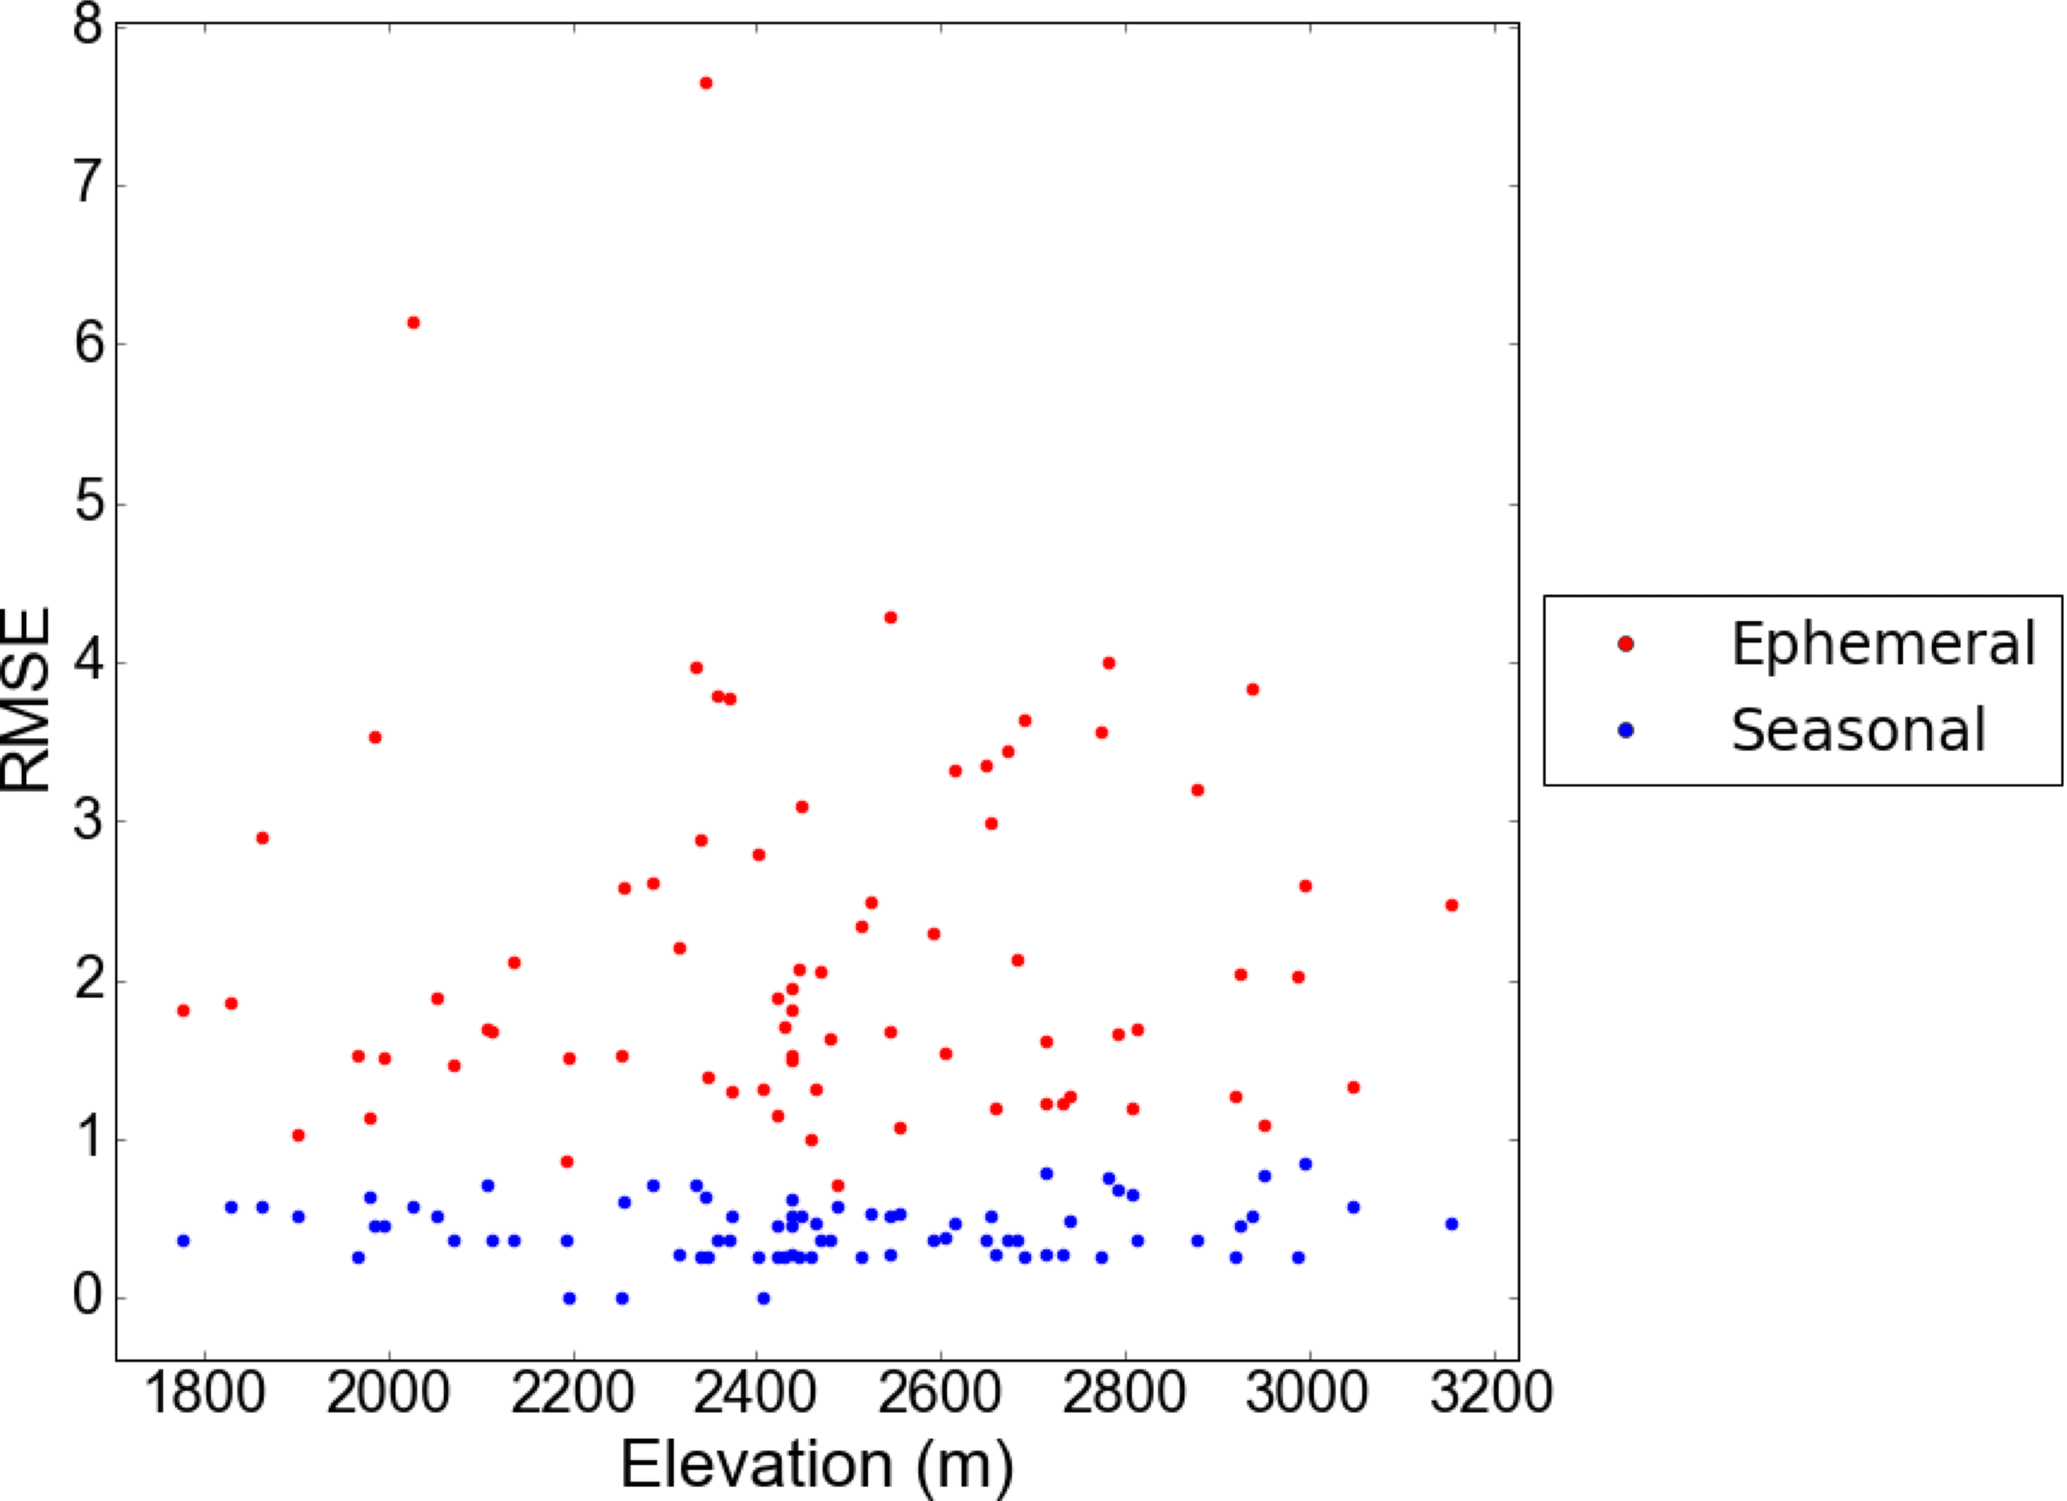
Figure A3Root mean square errors between the number of observed ephemeral and seasonal snow events at Snow Telemetry (SNOTEL) stations and the number of ephemeral and seasonal snow events derived from the algorithm in Google Earth Engine in each 500 m MODIS pixel corresponding to that station. Measured snow water equivalent of 0.3 cm or greater was used to determine snow presence for SNOTEL sites.
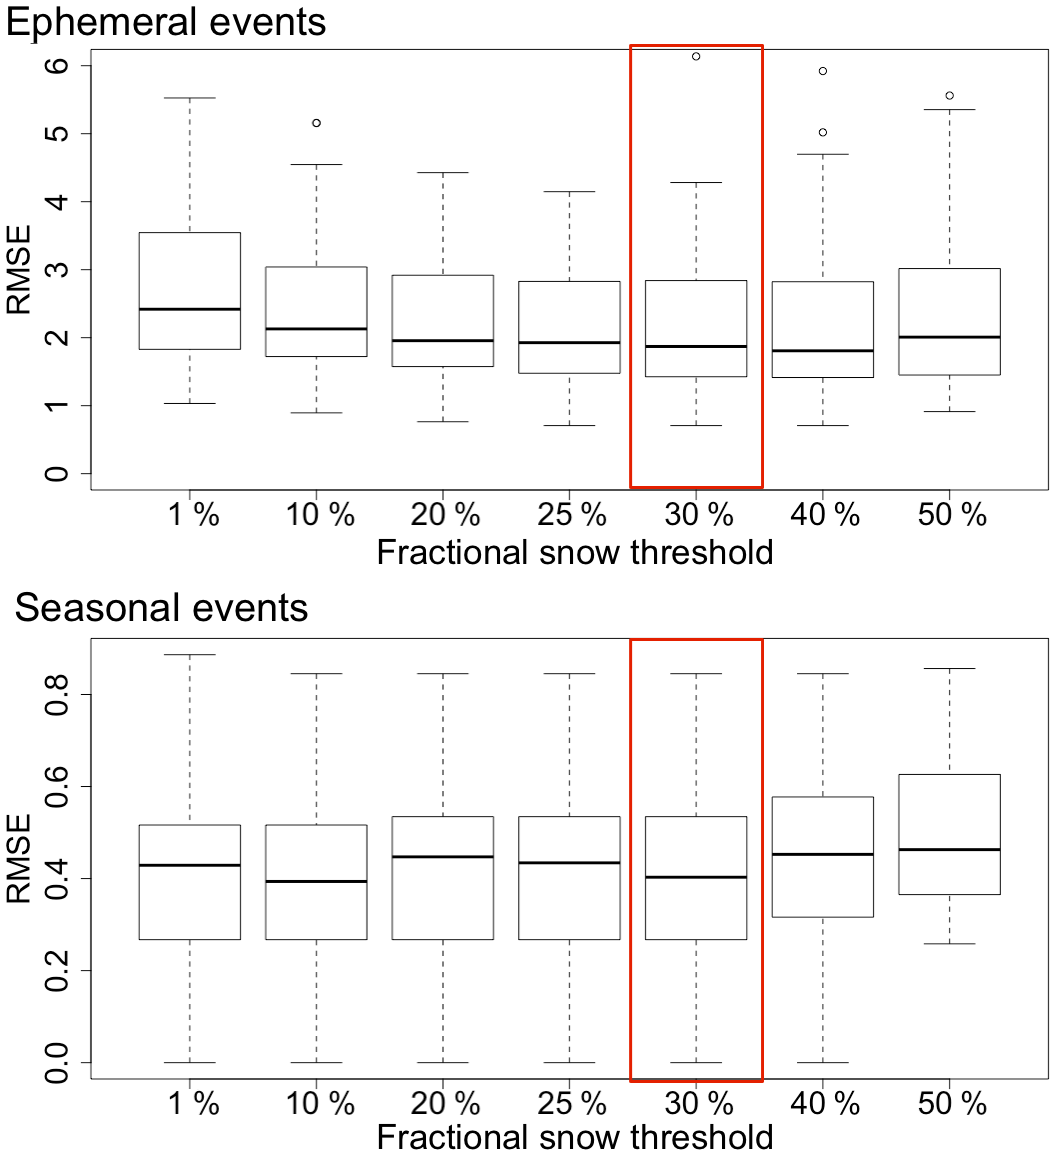
Figure A4Box plots depicting the root mean square errors between the number of observed ephemeral and seasonal snow events at Snow Telemetry (SNOTEL) stations and the number of ephemeral and seasonal snow events derived from the algorithm in Google Earth Engine in each 500 m MODIS pixel corresponding to that station at snow fractions of 1–50 %. The chosen snow fraction was 30 % (highlighted in red).
AH conceived the idea. RP and AH designed the study. RP created the algorithms and performed the analysis. Both RP and AH interpreted the data and wrote the paper.
The author declares that there is no conflict of interest.
This article is part of the special issue “Understanding and predicting Earth system and hydrological change in cold regions”. It is not associated with a conference.
We acknowledge the NASA Space Grant Consortium and USDA NIFA NEV05293 for
providing funding. Patrick Longley helped in creating the snow ephemerality
metric. Charles Morton of the Desert Research Institute and the members of
the Google Groups Earth Engine Forum helped with Google Earth Engine. We also
thank Scott Tyler for his support.
Edited by: Sean Carey
Reviewed by: two anonymous referees
Abatzoglou, J. T.: Development of gridded surface meteorological data for ecological applications and modelling, Int. J. Climatol., 33, 121–131, https://doi.org/10.1002/joc.3413, 2012. a, b
Anderton, S. P., White, S. M., and Alvera, B.: Micro-scale spatial variability and the timing of snowmelt runoff in a high mountain catchment, J. Hydrol., 268, 158–176, https://doi.org/10.1016/S0022-1694(02)00179-8, 2002. a
Bales, R. C., Molotch, N. P., Painter, T. H., Dettinger, M. D., Rice, R., and Dozier, J.: Mountain hydrology of the western United States, Water Resour. Res., 42, W08432, https://doi.org/10.1029/2005WR004387, 2006. a, b
Barnett, T. P., Adam, J. C., and Lettenmaier, D. P.: Potential impacts of a warming climate on water availability in snow-dominated regions, Nature, 438, 303–309, 2005. a
Barnhart, T. B., Molotch, N. P., Livneh, B., Harpold, A. A., Knowles, J. F., and Schneider, D.: Snowmelt rate dictates streamflow, Geophys. Res. Lett., 43, 8006–8016, 2016. a
Berghuijs, W., Woods, R., and Hrachowitz, M.: A precipitation shift from snow towards rain leads to a decrease in streamflow, Nat. Clim. Change, 4, 583–586, 2014. a, b
Bishop, M. P., Björnsson, H., Haeberli, W., Oerlemans, J., Shroder, J. F., and Tranter, M.: Encyclopedia of snow, ice and glaciers, Springer Science & Business Media, New York, NY, USA, 2011. a
Choi, G., Robinson, D. A., and Kang, S.: Changing Northern Hemisphere Snow Seasons, J. Climate, 23, 5305–5310, https://doi.org/10.1175/2010JCLI3644.1, 2010. a
Cline, D. W.: Effect of seasonality of snow accumulation and melt on snow surface energy exchanges at a continental alpine site, J. Appl. Meteorol., 36, 32–51, 1997. a, b, c
Clow, D. W.: Changes in the Timing of Snowmelt and Streamflow in Colorado: A Response to Recent Warming, J. Climate, 23, 2293–2306, https://doi.org/10.1175/2009JCLI2951.1, 2010. a
Clow, D. W., Nanus, L., Verdin, K. L., and Schmidt, J.: Evaluation of SNODAS snow depth and snow water equivalent estimates for the Colorado Rocky Mountains, USA, Hydrol. Process., 26, 2583–2591, 2012. a, b
Earman, S., Campbell, A. R., Phillips, F. M., and Newman, B. D.: Isotopic exchange between snow and atmospheric water vapor: Estimation of the snowmelt component of groundwater recharge in the southwestern United States, J. Geophys. Res., 111, D09302, https://doi.org/10.1029/2005JD006470, 2006. a
Essery, R., Rutter, N., Pomeroy, J., Baxter, R., Stähli, M., Gustafsson, D., Barr, A., Bartlett, P., and Elder, K.: SNOWMIP2: An evaluation of forest snow process simulations, B. Am. Meteorol. Soc., 90, 1120–1135, 2009. a
Farr, T. G., Rosen, P. A., Caro, E., Crippen, R., Duren, R., Hensley, S., Kobrick, M., Paller, M., Rodriguez, E., Roth, L., Seal, D., Shaffer, S., Shimada, J., Umland, J., Werner, M., Oskin, M., Burbank, D., and Alsdorf, D.: The Shuttle Radar Topography Mission, Rev. Geophys., 45, RG2004, https://doi.org/10.1029/2005RG000183, 2007. a
Gao, Y., Xie, H., and Yao, T.: Developing snow cover parameters maps from MODIS, AMSR-E, and blended snow products, Photogramm. Eng. Rem. S., 77, 351–361, 2011. a
Gorelick, N., Hancher, M., Dixon, M., Ilyushchenko, S., Thau, D., and Moore, R.: Google Earth Engine: Planetary-scale geospatial analysis for everyone, Remote Sens. Environ., 202, 18–27, 2017. a
Greuell, W. and Smeets, P.: Variations with elevation in the surface energy balance on the Pasterze (Austria), J. Geophys. Res., 106, 31717–31727, 2001. a
Hall, D., Salomonson, V., and Riggs, G.: MODIS/Terra snow cover daily L3 global 500 m grid, Version 5.[Tile h09v04], National Snow and Ice Data Center, Boulder, Colorado, USA, 2006. a
Hall, D. K., Riggs, G. A., Salomonson, V. V., Barton, J., Casey, K., Chien, J., DiGirolamo, N., Klein, A., Powell, H., and Tait, A.: Algorithm theoretical basis document (ATBD) for the MODIS snow and sea ice-mapping algorithms, NASA GSFC, Greenbelt, MD, USA, 2001. a
Harpold, A., Brooks, P., Rajagopal, S., Heidbuchel, I., Jardine, A., and Stielstra, C.: Changes in snowpack accumulation and ablation in the intermountain west, Water Resour. Res., 48, W11501, https://doi.org/10.1029/2012WR011949, 2012. a
Harpold, A. A.: Diverging sensitivity of soil water stress to changing snowmelt timing in the Western US, Adv. Water Resour., 92, 116–129, 2016. a
Harpold, A. A. and Molotch, N. P.: Sensitivity of soil water availability to changing snowmelt timing in the western US, Geophys. Res. Lett., 42, 8011–8020, 2015. a, b, c
Harpold, A. A., Rajagopal, S., Crews, J., Winchell, T., and Schumer, R.: Relative humidity has uneven effects on shifts from snow to rain over the western US, Geophys. Res. Lett., 44, 9742–9750, 2017a. a
Harpold, A. A., Kaplan, M. L., Klos, P. Z., Link, T., McNamara, J. P., Rajagopal, S., Schumer, R., and Steele, C. M.: Rain or snow: hydrologic processes, observations, prediction, and research needs, Hydrol. Earth Syst. Sci., 21, 1–22, https://doi.org/10.5194/hess-21-1-2017, 2017b. a, b
Harstveit, K.: Snowmelt modelling and energy exchange between the atmosphere and a melting snow cover, in: Proceedings of 18th International Conference for Alpine Meteorology, 1984, Opatija, Croatia (formerly Yugoslavia), 334–337, 1984. a
Hawkins, T. W. and Ellis, A. W.: A case study of the energy budget of a snowpack in the arid, subtropical climate of the southwestern United States, Journal of the Arizona-Nevada Academy of Science, 39, 1–13, 2007. a, b
Hedrick, A., Marshall, H.-P., Winstral, A., Elder, K., Yueh, S., and Cline, D.: Independent evaluation of the SNODAS snow depth product using regional-scale lidar-derived measurements, The Cryosphere, 9, 13–23, https://doi.org/10.5194/tc-9-13-2015, 2015. a, b
Hinckley, E.-L. S., Ebel, B. A., Barnes, R. T., Anderson, R. S., Williams, M. W., and Anderson, S. P.: Aspect control of water movement on hillslopes near the rain–snow transition of the Colorado Front Range, Hydrol. Process., 28, 74–85, https://doi.org/10.1002/hyp.9549, 2014. a
Hood, E., Williams, M., and Cline, D.: Sublimation from a seasonal snowpack at a continental, mid-latitude alpine site, Hydrol. Process., 13, 1781–1797, 1999. a, b
Hu, J., Moore, D. J., Burns, S. P., and Monson, R. K.: Longer growing seasons lead to less carbon sequestration by a subalpine forest, Glob. Change Biol., 16, 771–783, 2010. a
Hunsaker, C. T., Whitaker, T. W., and Bales, R. C.: Snowmelt runoff and water yield along elevation and temperature gradients in California's southern Sierra Nevada, JAWRA J. Am. Water Resour. As., 48, 667–678, 2012. a
Inouye, D. W.: Effects of climate change on phenology, frost damage, and floral abundance of montane wildflowers, Ecology, 89, 353–362, 2008. a
Jasechko, S., Birks, S. J., Gleeson, T., Wada, Y., Fawcett, P. J., Sharp, Z. D., McDonnell, J. J., and Welker, J. M.: The pronounced seasonality of global groundwater recharge, Water Resour. Res., 50, 8845–8867, 2014. a
Jefferson, A. J.: Seasonal versus transient snow and the elevation dependence of climate sensitivity in maritime mountainous regions, Geophys. Res. Lett., 38, L16402, https://doi.org/10.1029/2011GL048346, 2011. a, b, c
Jost, G., Weiler, M., Gluns, D. R., and Alila, Y.: The influence of forest and topography on snow accumulation and melt at the watershed-scale, J. Hydrol., 347, 101–115, https://doi.org/10.1016/j.jhydrol.2007.09.006, 2007. a, b, c
Karlsen, S. R., Solheim, I., Beck, P. S., Høgda, K. A., Wielgolaski, F. E., and Tømmervik, H.: Variability of the start of the growing season in Fennoscandia, 1982–2002, Int. J. Biometeorol., 51, 513–524, 2007. a
Kelleners, T., Chandler, D., McNamara, J. P., Gribb, M. M., and Seyfried, M.: Modeling runoff generation in a small snow-dominated mountainous catchment, Vadose Zone J., 9, 517–527, 2010. a, b
Kimball, J., McDonald, K., Frolking, S., and Running, S.: Radar remote sensing of the spring thaw transition across a boreal landscape, Remote Sens. Environ., 89, 163–175, https://doi.org/10.1016/j.rse.2002.06.004, 2004. a
Klos, P. Z., Link, T. E., and Abatzoglou, J. T.: Extent of the rain snow transition zone in the western US under historic and projected climate, Geophys. Res. Lett., 41, 4560–4568, 2014. a, b, c
Knowles, J. F., Harpold, A. A., Cowie, R., Zeliff, M., Barnard, H. R., Burns, S. P., Blanken, P. D., Morse, J. F., and Williams, M. W.: The relative contributions of alpine and subalpine ecosystems to the water balance of a mountainous, headwater catchment, Hydrol. Process., 29, 4794–4808, 2015. a, b
Knowles, N. and Cayan, D. R.: Elevational dependence of projected hydrologic changes in the San Francisco estuary and watershed, Climatic Change, 62, 319–336, 2004. a, b
Kormos, P. R., Marks, D., McNamaraa, J. P., Marshall, H. P., Winstral, A., and Flores, A. N.: Snow distribution, melt and surface water inputs to the soil in the mountain rain–snow transition zone, J. Hydrol., 519, 190–204, https://doi.org/10.1016/j.jhydrol.2014.06.051, 2014. a, b, c
Leathers, D. J., Graybeal, D., Mote, T., Grundstein, A., and Robinson, D.: The role of airmass types and surface energy fluxes in snow cover ablation in the central Appalachians, J. Appl. Meteorol., 43, 1887–1899, 2004. a, b, c
Liang, X., Lettenmaier, D. P., Wood, E. F., and Burges, S. J.: A simple hydrologically based model of land surface water and energy fluxes for general circulation models, J. Geophys. Res., 99, 14415–14428, 1994. a
Liston, G. E.: Local advection of momentum, heat, and moisture during the melt of patchy snow covers, J. Appl. Meteorol., 34, 1705–1715, 1995. a
Liston, G. E. and Elder, K.: A Distributed Snow-Evolution Modeling System (SnowModel), J. Hydrometeorol., 7, 1259–1276, https://doi.org/10.1175/JHM548.1, 2006. a, b
Lundquist, J. D., Neiman, P. J., Martner, B., White, A. B., Gottas, D. J., and Ralph, F. M.: Rain versus snow in the Sierra Nevada, California: Comparing Doppler profiling radar and surface observations of melting level, J. Hydrometeorol., 9, 194–211, 2008. a
Marks, D. and Dozier, J.: Climate and energy exchange at the snow surface in the alpine region of the Sierra Nevada: 2. Snow cover energy balance, Water Resour. Res., 28, 3043–3054, 1992. a
Marks, D., Link, T., Winstral, A., and Garen, D.: Simulating snowmelt processes during rain-on-snow over a semi-arid mountain basin, Ann. Glaciol., 32, 195–202, 2001. a
McNamara, J. P., Chandler, D., Seyfried, M., and Achet, S.: Soil moisture states, lateral flow, and streamflow generation in a semi-arid, snowmelt-driven catchment, Hydrol. Process., 19, 4023–4038, https://doi.org/10.1002/hyp.5869, 2005. a, b, c, d, e, f, g
Mernild, S. H., Liston, G. E., Hiemstra, C. A., Malmros, J. K., Yde, J. C., and McPhee, J.: The Andes Cordillera. Part I: snow distribution, properties, and trends (1979–2014), Int. J. Climatol., 37, 1680–1698, 2017. a
Molotch, N. P. and Meromy, L.: Physiographic and climatic controls on snow cover persistence in the Sierra Nevada Mountains, Hydrol. Process., 28, 4573–4586, 2014. a
Mote, P. W.: Climate-driven variability and trends in mountain snowpack in western North America, J. Climate, 19, 6209–6220, 2006. a, b, c
Mote, P. W., Hamlet, A. F., Clark, M. P., and Lettenmaier, D. P.: Declining mountain snowpack in western North America, B. Am. Meteorol. Soc., 86, 39–50, 2005. a
Nitta, T., Yoshimura, K., Takata, K., O'ishi, R., Sueyoshi, T., Kanae, S., Oki, T., Abe-Ouchi, A., and Liston, G. E.: Representing Variability in Subgrid Snow Cover and Snow Depth in a Global Land Model: Offline Validation, J. Climate, 27, 3318–3330, https://doi.org/10.1175/JCLI-D-13-00310.1, 2014. a
Nolin, A. W. and Daly, C.: Mapping “at risk” snow in the Pacific Northwest, J. Hydrometeorol., 7, 1164–1171, 2006. a
Parida, B. R. and Buermann, W.: Increasing summer drying in North American ecosystems in response to longer nonfrozen periods, Geophys. Res. Lett., 41, 5476–5483, 2014. a
Petersky, R. and Harpold, A.: Now You See It Now You Don't: A Case Study of Ephemeral Snowpacks in the Great Basin U.S.A., ScholarWorks, available at: https://scholarworks.unr.edu/handle/11714/2952, last access: 11 September 2018. a
Pomeroy, J.: Transport and sublimation of snow in wind-scoured alpine terrain, in: Snow, Hydrology and Forests in Alpine Areas, edited by: Bergman, H., Lang, H., Frey, W., Issler, D., and Salm, B., IAHS Press, 205, 131–140, 1991. a
Pomeroy, J., Toth, B., Granger R., Hedstrom, N., and Essery, R.: Variation in surface energetics during snowmelt in a subarctic mountain catchment, J. Hydrometeorol., 4, 702–719, 2003. a
Schmucki, E., Marty, C., Fierz, C., and Lehning, M.: Evaluation of modelled snow depth and snow water equivalent at three contrasting sites in Switzerland using SNOWPACK simulations driven by different meteorological data input, Cold Reg. Sci. Technol., 99, 27–37, https://doi.org/10.1016/j.coldregions.2013.12.004, 2014. a
Schmucki, E., Marty, C., Fierz, C., Weingartner, R., and Lehning, M.: Impact of climate change in Switzerland on socioeconomic snow indices, Theor. Appl. Climatol., 127, 875–889, 2017. a
Schwinning, S. and Sala, O. E.: Hierarchy of responses to resource pulses in arid and semi-arid ecosystems, Oecologia, 141, 211–220, 2004. a, b
Seaber, P. R., Kapinos, F. P., and Knapp, G. L.: Hydrologic Unit Maps, US Government Printing Office, Denver, CO, USA, 1987. a
Şensoy, A., Şorman, A., Tekeli, A., Şorman, A., and Garen, D.: Point-scale energy and mass balance snowpack simulations in the upper Karasu basin, Turkey, Hydrol. Process., 20, 899–922, 2006. a, b
Serreze, M. C., Clark, M. P., Armstrong, R. L., McGinnis, D. A., and Pulwarty, R. S.: Characteristics of the western United States snowpack from snowpack telemetry (SNOTEL) data, Water Resour. Res., 35, 2145–2160, 1999. a
Seyfried, M., Grant, L., Marks, D., Winstral, A., and McNamara, J.: Simulated soil water storage effects on streamflow generation in a mountainous snowmelt environment, Idaho, USA, Hydrol. Process., 23, 858–873, 2009. a
Slater, A. G., Lawrence, D. M., and Koven, C. D.: Process-level model evaluation: a snow and heat transfer metric, The Cryosphere, 11, 989–996, https://doi.org/10.5194/tc-11-989-2017, 2017. a, b, c, d
Sospedra-Alfonso, R. and Merryfield, W. J.: Influences of Temperature and Precipitation on Historical and Future Snowpack Variability over the Northern Hemisphere in the Second Generation Canadian Earth System Model, J. Climate, 30, 4633–4656, https://doi.org/10.1175/JCLI-D-16-0612.1, 2017. a
Sospedra-Alfonso, R., Mudryk, L., Merryfield, W., and Derksen, C.: Representation of Snow in the Canadian Seasonal to Interannual Prediction System. Part I: Initialization, J. Hydrometeorol., 17, 1467–1488, https://doi.org/10.1175/JHM-D-14-0223.1, 2016. a
Stewart, I. T., Cayan, D. R., and Dettinger, M. D.: Changes toward earlier streamflow timing across western North America, J. Climate, 18, 1136–1155, 2005. a
Stielstra, C. M., Lohse, K. A., Chorover, J., McIntosh, J. C., Barron-Gafford, G. A., Perdrial, J. N., Litvak, M., Barnard, H. R., and Brooks, P. D.: Climatic and landscape influences on soil moisture are primary determinants of soil carbon fluxes in seasonally snow-covered forest ecosystems, Biogeochemistry, 123, 447–465, 2015. a
Sturm, M., Holmgren, J., and Liston, G. E.: A seasonal snow cover classification system for local to global applications, J. Climate, 8, 1261–1283, 1995. a, b, c, d, e, f
Sturm, M., Taras, B., Liston, G. E., Derksen, C., Jonas, T., and Lea, J.: Estimating Snow Water Equivalent Using Snow Depth Data and Climate Classes, J. Hydrometeorol., 11, 1380–1394, https://doi.org/10.1175/2010JHM1202.1, 2010. a
Sturm, M., Goldstein, M. A., and Parr, C.: Water and life from snow: A trillion dollar science question, Water Resour. Res., 53, 3534–3544, https://doi.org/10.1002/2017WR020840, 2017. a, b
Sugg, J. W., Perry, L. B., Hall, D. K., Riggs, G. A., and Badurek, C. A.: Satellite perspectives on the spatial patterns of new snowfall in the Southern Appalachian Mountains, Hydrol. Process., 28, 4602–4613, 2014. a
Svejcar, T.: The Northern Great Basin: A Region of Continual Change, Rangelands, 37, 114–118, https://doi.org/10.1016/j.rala.2015.03.002, 2015. a, b
Thompson, J. A. and Lees, B. G.: Applying object-based segmentation in the temporal domain to characterise snow seasonality, ISPRS J. Photogramm., 97, 98–110, 2014. a, b, c
Trujillo, E. and Molotch, N. P.: Snowpack regimes of the western United States, Water Resour. Res., 50, 5611–5623, 2014. a
Trujillo, E., Molotch, N. P., Goulden, M. L., Kelly, A. E., and Bales, R. C.: Elevation-dependent influence of snow accumulation on forest greening, Nat. Geosci., 5, 705–709, 2012. a, b
Tyler, S. W., Burak, S. A., McNamara, J. P., Lamontagne, A., Selker, J. S., and Dozier, J.: Spatially distributed temperatures at the base of two mountain snowpacks measured with fiber-optic sensors, J. Glaciol., 54, 673–679, 2008. a, b, c, d
Wang, Z., Schaaf, C. B., Strahler, A. H., Chopping, M. J., Roman, M. O., Shuai, Y., Woodcock, C. E., Hollinger, D. Y., and Fitzjarrald, D. R.: Evaluation of MODIS albedo product (MCD43A) over grassland, agriculture and forest surface types during dormant and snow-covered periods, Remote Sens. Environ., 140, 60–77, 2014. a
West, N.: Great Basin-Colorado plateau sagebrush semi-desert, Temperate Deserts and Semi-Deserts, 5, 331–369, 1983. a
Winchell, T. S., Barnard, D. M., Monson, R. K., Burns, S. P., and Molotch, N. P.: Earlier snowmelt reduces atmospheric carbon uptake in midlatitude subalpine forests, Geophys. Res. Lett., 43, 8160–8168, 2016. a
Winstral, A., Marks, D., and Gurney, R.: Simulating wind-affected snow accumulations at catchment to basin scales, Adv. Water Resour., 55, 64–79, 2013. a, b